


Feasibility Study Results Pre-Tax: US$6.4B NPV (8%) 30% IRR
7.3 Year Payback on Integrated Project
With Defense Production Act Title III Funding, the Feasibility Study was completed 15 months ahead of schedule
Graphite One Enters Permitting Phase as Presidential Critical Mineral Executive Order calls for “Immediate Measures to Increase American Mineral Production” and “Unleashing Alaska’s Extraordinary Resource Potential”
Graphite One Inc. (TSX-V: GPH) (OTCQX: GPHOF) is pleased to announce the results and the filing of its National Instrument 43-101 – Standards of Disclosure for Mineral Projects technical report relating to the Feasibility Study for the Company’s U.S. Based Anode Active Material Supply Chain Project.
In this news release, all dollar amounts are in United States dollars and all units of mass are in metric tonnes.
“Our Feasibility Study represents a major milestone for G1 on our path to production and validates the efforts we’ve made with the Department of Defense’s DPA Title III support to complete our FS 15 months ahead of schedule, while tripling the size of our Graphite Creek resource,” said Anthony Huston, CEO of Graphite One. “With President Trump’s Critical Mineral and Alaska Executive Orders, Graphite One is positioned to be at the leading edge of a domestic Critical Mineral renaissance that will power transformational applications from energy and transportation to AI infrastructure and national defense.”
The FS was prepared by Barr Engineering Co. with assistance from various independent technical consultants. The effective date of the FS is March 25, 2025, and a NI 43-101 technical report relating to the FS will be filed on the Company’s SEDAR+ profile at www.sedarplus.ca and on the Company’s website.
The Project is planned as an integrated business operation to produce lithium-ion battery anode materials and other graphite products for the U.S domestic market on a commercial scale using primarily natural graphite from Alaska. The Project combines the operation of the STP, an advanced graphite manufacturing facility to be located in Ohio, with the supply of natural flake graphite from the Company’s proposed Graphite Creek Mine in Alaska. The resources associated with the Company’s Alaska State mining claims were cited by the U.S. Geological Survey in January 2022 as America’s largest natural graphite deposit[1], and in 2023, “as among the largest in the world.” This statement is prior to the increased resource amount verified by G1 in the FS.
Reduced Capital Risk Development Strategy
The Project is planned to be implemented with a capital risk reduction strategy that develops the Ohio STP in seven 25,000 tpy modules while the Mine completes permitting and construction. This modular approach allows for capital expenditures to be deployed progressively, in line with each phase of development, significantly reducing the upfront capital to $607 million, including $121 million of contingency for the first 25,000 tpy module. Each subsequent module is estimated to cost $552 million, including contingency. As a result, the Company expects to achieve 50,000 tpy of commercial natural graphite production by 2028 and 175,000 tpy by 2031, one year after the Mine is expected to begin production, subject to various conditions. Manufacturing would begin with purchased natural graphite until the Mine’s graphite production is available.
“We will now enter the permitting process with a production rate triple what we projected just over two years ago. Our proven and probable reserve and contained graphite tripled from the reserve and contained graphite disclosed in the PFS. And all of this is based on FS level resource drilling results from just 12% of the 15.3 km (9.5 mile) long graphite mineralized zone as defined by geophysics and wide spaced drilling (see Figure 1),” Mr. Huston noted.
| ____________________________ |
| 1 https://www.usgs.gov/data/graphite-deposits-united-states |
Summary of FS Economics
Tables 1 and 2 present a summary of the estimated FS economic results.
Table 1: Summary of Estimated FS Economic Results
| Economic Parameters | Project | STP | Mine | |
| Pre-tax | NPV (8%) | $6,397 M | ||
| IRR | 30 % | |||
| Payback | 7.3 Years | |||
| Post-tax | NPV (8%) | $5,030 M | ||
| IRR | 27 % | |||
| Payback | 7.5 Years | |||
| Average Annual Production (t/year) | 256,510 | 175,000 | ||
| Initial and Sustaining Capital Costs 1 | $4,167 M | $3,136 M | $1,031 M | |
| Capital Contingency Costs | $878 M | $784 M | $94 M | |
| Total Capital Costs | $5,045 M | $3,920 M | $1,125 M | |
|
1. Non-IFRS Financial Measure as defined below |
||||
Table 2: Summary of Estimated Operating Costs
| Operating Costs – Mine | $/t Concentrate | LOM $ M |
| Total Mined Graphite Concentrate | $610.0 | $2,149 |
| Total Transportation to Ohio | $372.4 | $1,311 |
| Total Mine and Transportation Costs | $982.4 | $3,460 |
| Operating Costs – STP | $/t Production | LOM $ M |
| Secondary Treatment Plant | $2,119 | $11,804 |
| Purchased Graphite Concentrate | $64 | $355 |
| Mined Graphite Concentrate & Transportation | $621 | $3,460 |
| Total Operating Costs – STP | $2,804 | $15,619 |
The Project’s post-tax IRR includes the estimated effects of Advanced Manufacturing Tax Credits provided under U.S. Internal Revenue Code Section 45X for qualifying anode active material and critical mineral production.
Based on the FS’s updated graphite reserve estimate, the Mine’s life for the purposes of the FS would be 20 years. The FS assumes the STP’s operational life is 22 years based on its startup with purchased graphite and continued operation with graphite from the Mine.
The STP would produce a targeted average of 256,500 tpy of graphite/carbon products. About 169,000 tpy would be AAM, 25,000 tpy purified graphite products, and 31,000 tpy of unpurified graphite and carbon products. The non-AAM products would serve industrial and defense industry based sectors.
The AAM products are:
Based on the FS assumptions, the average price of all products over the STP’s life is estimated at $7,843 per tonne. Product forecasts and prices have been developed based on numerous graphite market reports commissioned by or purchased by the Company, combined with the Company’s internal information. The long-term market forecast is based on Benchmark Mineral Intelligence’s various Q4 2024 price forecasts.
The estimated capital costs with their respective contingencies are summarized in Table 1.
Secondary Treatment Plant
The STP is designed to produce lithium-ion battery AAM on a commercial scale for the U.S. domestic market using natural graphite from Alaska as soon as it is available. At full capacity, it requires about 89.3 hectares (220 acres) of land, consists of 88 buildings, and would target to produce 256,500 tonnes of manufactured graphite and carbon products annually. The products are grouped into battery AAMs, specialty purified graphite products, traditional unpurified graphite products, carbon raiser, and coke reject. The products are manufactured from natural graphite concentrate, artificial graphite, artificial graphite precursors, coke, and pitch. Key components of the manufacturing process are the purification of natural graphite and graphitization of artificial graphite precursors in high temperature, electrically heated furnaces. The STP’s planned location is in Ohio to access both its relatively lower power rates, its skilled workforce, and location relative to potential customers.
Permitting, final design, and construction of the first 50,000 tpy of STP natural graphite capacity is expected to take three years. Modular build out of the total 175,000 tpy facility is expected to take about four more years depending on funding and customer demand.
The STP, at full capacity (Table 3), is designed to produce 169,000 tpy of AAM for the electric vehicle and energy storage battery markets; 25,000 tpy of purified, sized material for the speciality graphite market; and 31,000 tpy of unpurified and carbon products for the traditional graphite market. Total annual production is anticipated to be 256,500 tonnes based on the expected annual production capacity.
|
Table 3: STP Targeted Products and Estimated Prices |
|||||||||
| No. | Category | Name | Description | Purity (%Cg) | Ph 1 (tpy) | Ph 2
(tpy) |
Ph 3 (tpy) | Ph4 (tpy) | $/t 1 |
| 1 | Anode Material | CPN | Coated, spherical NG | 99.95 | 11,325 | 22,651 | 33,976 | 39,639 | $8,424 |
| 2 | BAN | Blended AG and NG | 99.95 | 21,572 | 43,144 | 64,716 | 75,502 | $11,563 | |
| 3 | SPN | Secondary Particle NG | 99.95 | 3,474 | 6,949 | 10,423 | 12,160 | $10,971 | |
| 4 | SPC | Secondary Particle Composite | 99.95 | 12,024 | 24,048 | 36,073 | 42,085 | $10,971 | |
| 5 | Purified | 3299 | +32 Mesh Purified | 99+ | 110 | 221 | 331 | 386 | $4,569 |
| 6 | 599 | +50 Mesh Purified | 99+ | 994 | 1,989 | 2,983 | 3,480 | $3,884 | |
| 7 | 899 | +80 Mesh Purified | 99+ | 1,104 | 2,209 | 3,313 | 3,866 | $3,066 | |
| 8 | 199 | +100 Mesh Purified | 99+ | 1,842 | 3,683 | 5,525 | 6,446 | $2,547 | |
| 9 | Battery Conductor | -320 Mesh Purified | 99.9 | 1,308 | 2,617 | 3,925 | 4,580 | $5,357 | |
| 10 | Synthetic Diamond Precursor | -320 Mesh Purified | 99.99 | 1,794 | 3,587 | 5,381 | 6,278 | $5,974 | |
| 11 | Unpurified | 3295 | +32 Mesh | 95+ | 180 | 360 | 540 | 630 | $1,683 |
| 12 | 595 | +50 Mesh | 95+ | 1,620 | 3,240 | 4,860 | 5,670 | $1,683 | |
| 13 | 895 | +80 Mesh | 95+ | 1,799 | 3,598 | 5,397 | 6,297 | $1,564 | |
| 14 | 195 | +100 Mesh | 95+ | 3,000 | 6,001 | 9,001 | 10,502 | $1,256 | |
| 15 | Carbon Raisers Lubricants | Carbon Raisers Lubricants | 95+ | 8,842 | 17,685 | 26,527 | 30,948 | $2,122 | |
| 16 | Coke Reject | Coke Reject | 95+ | 2,298 | 4,596 | 6,894 | 8,043 | $610 | |
| Total | 73,289 | 146,577 | 219,866 | 256,510 | $7,843 | ||||
| 1. | Artificial graphite AAM prices include equivalent of 48.7% tariff. Natural graphite AAM prices include equivalent of 20% tariff. | ||||||||
Graphite Creek Mine
The Mine would produce an average of 175,000 tpy of graphite concentrate for the projected 20-year mine life. The deposit would be mined with conventional open pit mining methods including drilling, blasting, loading, and hauling. The strip ratio in the FS plan is 3.2:1 with an ore variable cut-off grade of 2-3% graphitic carbon and an average head grade of 5.2% graphitic carbon. The pit would be mined in five phases over a period of 20 years. One year of pre-stripping would occur prior to the start-up of the process facility. Ore will be hauled to a process facility to be built adjacent to the pit. Run of mine waste would be comingled with dewatered process tails and placed in waste dumps.
The process facility would process an average of 10,000 tpd for 365 days per year. The flowsheet design is based on metallurgical test work conducted at SGS Canada Inc.’s facilities at Lakefield, Ontario. The flowsheet consists of a jaw crusher that feeds a semiautogenous grinding circuit. After grinding, the ore is subjected to a series of seven flotation and three regrind steps. The flotation/regrind steps are designed to recover the graphite at its largest possible flake size while still maintaining a concentrate with a graphitic carbon grade of greater than 95%. The graphite concentrate would be filtered and dried on site. The dried concentrate would be shipped by barge from Nome, Alaska to the STP in Ohio during the annual shipping season. The tails from the flotation circuit would be dewatered, comingled with the waste rock, and placed in a lined waste storage facility. Any drainage from the lined waste storage facility would be treated through a water treatment plant prior to discharge.
Risk Assessment and Mitigation
The risks and uncertainties identified for the Project are generally described in the Company’s 2024 Annual Management’s Discussion and Analysis statements filed on April 11, 2025 on the Company’s SEDAR+ profile at www.sedarplus.ca. These cover the Project’s financial, mining, processing, operating, market, and regulatory risks, all of which are common with similar projects.
Section 25.5 of the FS identifies Project risks specific to the Mine and STP during the construction and operational phases and outlines possible mitigation actions.
Mineral Resources and Reserves
The Graphite Creek property is located on the Seward Peninsula, Alaska about 37 miles (60 km) north of Nome. G1’s deposit is entirely on State land. The Property comprises 23,680 acres (9,600 hectares) of State of Alaska mining claims. The claim block consists of 176 claims, of which 163 are wholly owned by Graphite One (Alaska) Inc. and 13 are leased to Graphite One (Alaska) Inc. The graphite mineral zone is exposed on the surface and strikes East/Northeast along the North Face of the Kigluaik Mountains. The FS Pit and Mineral Reserve footprint represents just 1.2 miles (1.9 km) of the 9.5 miles (15.3 km) long electromagnetic anomaly (Figure 1).
Through 2022, 2023 and 2024, 90 holes have been drilled in the resource area for a total of 13,482 meters of drilling. The resource database consists of 22,806 assays. The resource remains open down dip, and along strike to the East and West.
The Mineral Resource estimate for Graphite Creek was updated with data through the 2024 drilling program. The methodology used was the same as that described in the PFS. A lower cut-off grade of 2% was used for the 2022 and 2024 resource. The FS Mineral Resource estimate for Graphite Creek is presented in Table 4 and is as of March 25, 2025.
Table 4: 2024 Feasibility Study Mineral Resource Estimate 2.0% Cg Cutoff Grade2
| Tonnage (M tonnes) |
%Cg | Cg (M Tonnes) |
|
| Measured | 5.1 | 5.3 % | 0.272 |
| Indicated | 99.6 | 4.5 % | 4.523 |
| Measured + Indicated | 104.7 | 4.6 % | 4.796 |
| Inferred | 268.1 | 4.3 % | 11.568 |
The 2023-2024 drilling program focused on converting Inferred Resources into Measured and Indicated, to allow annual graphite production to be increased in the FS. A comparison of the PFS and FS mineral resources can be seen in Table 5.
Table 5: Mineral Resource Comparison – 2024 FS vs 2023 PFS3
| Mineral Resource Classification | PFS | FS | Difference | ||||||
| Tonnage M Tonnes |
%Cg | Cg
M Tonnes |
Tonnage M Tonnes | %Cg | Cg
M Tonnes |
Tonnage
M Tonnes |
%Cg | Cg
M Tonnes |
|
| Measured | 4.67 | 5.8 % | 0.27 | 5.1 | 5.3 % | 0.27 | 0.43 | -0.5 % | – |
| Indicated | 27.87 | 5.2 % | 1.44 | 99.6 | 4.5 % | 4.52 | 71.73 | -0.7 % | 3.09 |
| M + I* | 32.5 | 5.3 % | 1.71 | 104.7 | 4.6 % | 4.80 | 72.1 | -0.7 % | 3.09 |
| Inferred | 254.67 | 5.1 % | 13.00 | 268.1 | 4.3 % | 11.57 | 13.43 | -0.8 % | (1.44) |
| * Measured + Indicated | |||||||||
| _______________________________ | |
| 2 Footnotes: | |
| a) | Mineral Resource Statement is effective, March 25, 2025 |
| b) | Mineral Resources are inclusive of Mineral Reserves. Mineral Resources that are not Mineral Reserves have not demonstrated economic viability. There is no certainty that any part of a Mineral Resource will ever be converted into Reserves. |
| c) | Inferred Mineral Resources represent material that is considered too speculative to be included in economic evaluations. Additional trenching and/or drilling will be required to convert Inferred Mineral Resources to Indicated or Measured Mineral Resources. It cannot be assumed that all or any part of the inferred resources will ever be upgraded to a higher resource category. |
The 2024 Mineral Reserve estimate consists of 71.219 Mt of Proven and Probable material at an average diluted grade of 5.22% graphite, yielding 3.7 Mt of contained graphite. A variable cut–off grade between 2%-3% was used in calculating the proven/probable reserve. Table 6 shows the FS Mineral Reserve estimate for Graphite Creek as of March 25, 2025.
Table 6: Graphite Creek Feasibility Study Mineral Reserve Estimate3
| Mineral Reserve Classification | Feasibility Study | ||
| Tonnage | %Cg | Cg | |
| (M tonnes) | (M Tonnes) | ||
| Proven | 4.1 | 5.8 % | 0.238 |
| Probable | 67.1 | 5.2 % | 3.48 |
| Proven and Probable | 71.2 | 5.2 % | 3.717 |
The FS Mineral Reserve estimate and contained graphite are 71.22 Mt and 3.7 Mt, respectively, an increase of 48.72 Mt and 2.46 Mt over the reserve and contained graphite disclosed in the PFS. A comparison of the PFS versus FS Mineral Reserve estimate can be seen in Table 7.
Table 7: Mineral Reserve Comparison – 2024 FS vs 2022 PFS
| Mineral Resource Classification | PFS | FS | Difference | ||||||
| Tonnage
M Tonnes |
%Cg | Cg
M Tonnes |
Tonnage
M Tonnes |
%Cg | Cg
M Tonnes |
Tonnage
M Tonnes |
%Cg | Cg
M Tonnes |
|
| Proven | 3.81 | 6.0 % | 0.23 | 4.10 | 5.8 % | 0.238 | 0.29 | -0.2 % | 0.01 |
| Probable | 18.70 | 5.5 % | 1.03 | 67.12 | 5.2 % | 3.48 | 48.42 | -0.3 % | 2.45 |
| P + P* | 22.50 | 5.6 % | 1.26 | 71.22 | 5.2 % | 3.72 | 48.72 | -0.4 % | 2.46 |
| *Proven + Probable | |||||||||
| _______________________________ | |
| 3Mineral Reserve Footnotes: | |
| a) | Mineral Reserves follow CIM definitions and are effective as of March 25, 2025. |
| b) | The Mineral Reserves are inclusive of mining dilution and ore loss. |
| c) | Mineral Reserves are estimated using a raised variable cut-off of 2.0% Cg – 3.0% Cg which is required to maximize secondary treatment production. The economic value is calculated based on a net average Graphite Price of US$1,200/t (including transport & treatment charges), 3.5% – 8.0% royalty, and a mill recovery of 90%. |
| d) | The final pit design contains an additional 17.4 Mt of Measured and Indicated resources between the raised cut-off grade (3.0% Cg) and the economic cut-off grade (2.0% Cg) at an average grade of 2.4% Cg. These resources have been treated as waste in the final mine production schedule. |
| e) | The final pit design contains an additional 40.4 Mt of Inferred resources above the economic cut-off grade (2.0% Cg) at an average grade of 3.9% Cg. Inferred Mineral Resources are considered too speculative geologically to have economic considerations applied to them that would enable them to be categorized as Mineral Reserves, and there is no certainty that any part of the Inferred Resources could be converted into Mineral Reserves. |
| f) | Tonnages are rounded to the nearest 1,000 t, graphite grades are rounded to two decimal places. Tonnage measurements are in metric units. |
| g) | Totals may not add due to rounding. |
Qualified Persons and NI 43-101 Technical Report
The FS for the Project is incorporated in a NI 43-101 technical report that is available under the Company’s SEDAR+ profile at www.sedarplus.ca and the Company’s website. The affiliation and areas of responsibility for each of the independent Qualified Persons (as defined under NI 43-101) are as follows:
| Qualified Person | Company | Responsibility |
| Jason Todd, QP | Barr Engineering | Primary QP |
| Chotipong Somrit, QP | Barr Engineering | OP Mining |
| Jed Greenwood, PE | Barr Engineering | OP Geotech |
| Jason Todd, QP | Barr Engineering | Economic Model |
| Robert Retherford, P.Geo. | Alaska Earth Science | Geology and Resource Estimate |
| Daniel R. Palo, P.Eng., PE | Barr Engineering | Primary Processing (AK) |
| Scott Phillips, PE | Barr Engineering | Water Treatment |
| Scott Phillips, PE | Barr Engineering | Water and Water Management |
| Arlene Dixon, PE | Hatch Engineering | STP Infrastructure |
| Jon Godwin, P. Eng. | Hatch Engineering | STP |
The QPs for this news release are Robert Retherford, P.Geo. and Jason Todd, QP. Mr. Retherford has reviewed this news release and verified that it accurately represents the geology and resource estimate that is stated. Mr. Todd reviewed the overall content.
Data Verification
During the course of their work, the QPs have validated the data that each used in the formulation of the resource estimate and FS findings. This includes such items as: site inspections, core sampling and assays, laboratory test work, core logs, environmental and community factors, metallurgical test work, taxation and royalties, and surveys. Both existing and new data that was collected through the course of the study were validated and used by the various QPs to inform their work. Details regarding the data used and quality assurance and quality control procedures that were employed by each QP in the preparation of the resource estimate and FS will be included in the FS as well as further definition on the precise roles, qualifications, and responsibilities of each QP.
Non-IFRS Financial Measures
The Company has included certain non-IFRS financial measures in this news release, such as Initial Capital Costs and Sustaining Capital Costs, which are not defined under IFRS and do not have a standardized meaning prescribed by IFRS. As a result, these measures may not be comparable to similar measures reported by other companies. Each of these measures used are intended to provide additional information to the user and should not be considered in isolation or as a substitute for measures prepared in accordance with IFRS.
Certain Non-IFRS financial measures used in this news release are defined below.
About Graphite One Inc.
GRAPHITE ONE INC. continues to develop its Graphite One Project (the “Project”), with the goal of becoming an American producer of high grade anode materials that is integrated with a domestic graphite resource. The Project is proposed as a vertically integrated enterprise to mine, process and manufacture high grade anode materials primarily for the lithium‐ion electric vehicle battery market.
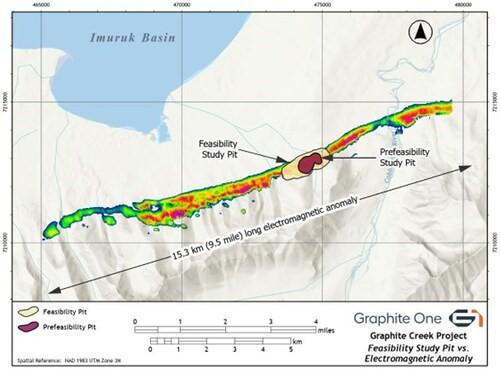
Figure 1: FS Pit Versus PFS Pit Superimposed on Electromagnetic Survey Anomaly (CNW Group/Graphite One Inc.)
Cygnus Metals Limited (ASX: CY5) (TSX-V: CYG) (OTCQB: CYGGF) is pleased to announce final in... READ MORE
Scorpio Gold Corp. (TSX-V: SGN) (OTCQB: SRCRF) (FSE: RY9) ... READ MORE
Cassiar Gold Corp. (TSX-V: GLDC) (OTCQX: CGLCF) is pleased to announce that, further to its news rel... READ MORE
Midland Exploration Inc. (TSX-V: MD) is pleased to announce that it has completed a second and fina... READ MORE
Wallbridge Mining Company Limited (TSX: WM) (OTCQB:WLBMF) is pleased to announce that it has closed... READ MORE


