


![]()
Aya Gold & Silver Inc. (TSX: AYA; OTCQX: AYASF) is pleased to announce an updated Mineral Resource Estimate prepared in accordance with National Instrument 43-101 – Standards of Disclosure for Mineral Projects at its Boumadine Project in the Kingdom of Morocco. The updated MRE contains an Inferred Mineral Resource of 29.2 million tonnes at 82 grams per tonne silver, 2.63 g/t gold, 2.11% zinc and 0.82% lead containing an estimated 76.8 million ounces of Ag, 2.4Moz of Au, 615 thousand tonnes of Zn and 237 kt of Pb and an Indicated Mineral Resource of 5.2Mt at 91 g/t Ag, 2.78 g/t Au, 2.8% Zn and 0.85% Pb containing an estimated 15.1 Moz of Ag, 449 kilo ounces of Au, 145 kt of Zn and 44 kt of Pb.
Highlights
“We are pleased to announce an updated Mineral Resource Estimate for Boumadine, marking a 120% increase in indicated resources and 19% in inferred resources since our April 2024 update,” said Benoit La Salle, President & CEO. “In under three years, we have grown silver and gold ounces across all classifications, demonstrating the team’s ability to identify and grow Boumadine into a world class asset.
“Drilling has primarily focused on the mining permit, which represents only a small portion of the broader mineralized footprint. Over the past two years, we have expanded our footprint by nearly 850% and continue to consolidate the area while aggressively testing extensions of known mineralized trends. Additionally, ongoing metallurgical studies are yielding promising results as we advance the project toward large-scale development.”
Boumadine Mineral Resource
The MRE is effective as of February 24, 2025, and includes drilling conducted from 2018 through December 1, 2024. The database comprises 428 surface diamond drill holes (“DDH”), totaling 142,268 meters. For this updated MRE, 93 new DDH, totaling 44,514m, were incorporated.
Historical mining was not depleted from the MRE as the exact position and physical extent could not be accurately measured. From the historical production reports, approximately 261kt of mineralized material were extracted and processed (less than 1% of the current MRE), therefore it is considered not material. Historical tailings were excluded from the MRE since the bulk density, volumes and grades were not properly evaluated. Molybdenum was excluded from both the cut-off and AgEq/AuEq calculations since the process recoveries were not evaluated.
Table 1 –Boumadine MRE, as of February 24, 2025 (1-12)
| Cutoff | Tonnes | Average Grade | Contained Metal | |||||||||||||
| Ag | Au | Cu | Pb | Zn | AgEq | AuEq | Ag | Au | Cu | Pb | Zn | AgEq | AuEq | |||
| NSR US$/t | (kt) | (g/t) | (g/t) | (%) | (%) | (%) | (g/t) | (g/t) | (koz) | (koz) | (kt) | (kt) | (kt) | (koz) | (koz) | |
| Pit-constrained Indicated |
95 | 3,920 | 94 | 2.99 | 0.13 | 0.84 | 2.95 | 476 | 5.30 | 11,881 | 343 | 5 | 33 | 116 | 60,051 | 667 |
| Pit-constrained Inferred |
95 | 14,258 | 90 | 2.89 | 0.10 | 0.81 | 2.38 | 450 | 5.00 | 41,135 | 1,102 | 14 | 115 | 339 | 206,293 | 2,293 |
| Out-of-pit Indicated |
125 | 1,249 | 80 | 2.11 | 0.08 | 0.87 | 2.32 | 358 | 3.98 | 3,216 | 106 | 1 | 11 | 29 | 14,382 | 160 |
| Out-of-pit Inferred |
125 | 14,938 | 74 | 2.39 | 0.07 | 0.82 | 1.85 | 357 | 3.97 | 35,669 | 1,294 | 10 | 122 | 276 | 171,393 | 1,905 |
| Total Indicated |
95/ 125 |
5,169 | 91 | 2.78 | 0.12 | 0.85 | 2.80 | 448 | 4.98 | 15,097 | 449 | 6 | 44 | 145 | 74,433 | 827 |
| Total Inferred |
95/ 125 |
29,196 | 82 | 2.63 | 0.08 | 0.82 | 2.11 | 402 | 4.47 | 76,804 | 2,396 | 25 | 237 | 615 | 377,686 | 4,198 |
Tables 2 and 3 – Cut-Off Sensitivity MRE (1-12)
| Indicated InPit and Underground Resources | ||||||||||||
| UG-OP | Tonnes | Ag | Ag | Au | Au | Cu | Pb | Zn | AgEq | AgEq | AuEq | AuEq |
| NSR US$/t | (kt) | (g/t) | (koz) | (g/t) | (koz) | (%) | (%) | (%) | (g/t) | (koz) | (g/t) | (koz) |
| 145-120 | 4,472 | 97 | 13,923 | 3.05 | 439 | 0.12 | 0.86 | 2.75 | 484 | 69,632 | 5.40 | 777 |
| 140-115 | 4,625 | 95 | 14,110 | 2.99 | 444 | 0.12 | 0.86 | 2.72 | 476 | 70,751 | 5.30 | 788 |
| 135-110 | 4,791 | 93 | 14,359 | 2.92 | 450 | 0.12 | 0.86 | 2.69 | 467 | 71,933 | 5.20 | 801 |
| 130-105 | 4,932 | 92 | 14,547 | 2.86 | 453 | 0.12 | 0.85 | 2.66 | 460 | 72,898 | 5.11 | 810 |
| 125-95 | 5,169 | 89 | 14,863 | 2.77 | 460 | 0.11 | 0.84 | 2.63 | 448 | 74,433 | 4.98 | 827 |
| 120-90 | 5,298 | 88 | 15,008 | 2.72 | 463 | 0.11 | 0.83 | 2.60 | 442 | 75,250 | 4.90 | 834 |
| 115-85 | 5,481 | 87 | 15,265 | 2.66 | 469 | 0.11 | 0.82 | 2.57 | 433 | 76,364 | 4.81 | 848 |
| 110-80 | 5,648 | 85 | 15,477 | 2.60 | 473 | 0.11 | 0.81 | 2.55 | 426 | 77,320 | 4.73 | 858 |
| 105-75 | 5,820 | 84 | 15,683 | 2.54 | 476 | 0.10 | 0.80 | 2.53 | 418 | 78,268 | 4.64 | 868 |
| 90-60 | 6,284 | 79 | 16,061 | 2.39 | 483 | 0.10 | 0.78 | 2.46 | 399 | 80,571 | 4.40 | 890 |
| Inferred InPit and Underground Resources | ||||||||||||
| UG-OP | Tonnes | Ag | Ag | Au | Au | Cu | Pb | Zn | AgEq | AgEq | AuEq | AuEq |
| NSR US$/t | (kt) | (g/t) | (koz) | (g/t) | (koz) | (%) | (%) | (%) | (g/t) | (koz) | (g/t) | (koz) |
| 145-120 | 24,023 | 90 | 69,342 | 2.86 | 2,211 | 0.09 | 0.87 | 2.14 | 441 | 340,641 | 4.90 | 3,786 |
| 140-115 | 25,128 | 88 | 70,937 | 2.80 | 2,261 | 0.09 | 0.86 | 2.12 | 432 | 349,042 | 4.80 | 3,880 |
| 135-110 | 26,218 | 86 | 72,627 | 2.73 | 2,304 | 0.08 | 0.85 | 2.10 | 424 | 357,154 | 4.71 | 3,970 |
| 130-105 | 27,538 | 84 | 74,537 | 2.66 | 2,355 | 0.08 | 0.83 | 2.08 | 414 | 366,533 | 4.60 | 4,074 |
| 125-95 | 29,196 | 82 | 76,803 | 2.57 | 2,413 | 0.08 | 0.82 | 2.06 | 402 | 377,685 | 4.47 | 4,198 |
| 120-90 | 30,517 | 80 | 78,494 | 2.51 | 2,463 | 0.08 | 0.80 | 2.03 | 394 | 386,356 | 4.38 | 4,294 |
| 115-85 | 31,780 | 78 | 80,098 | 2.45 | 2,506 | 0.08 | 0.80 | 2.01 | 386 | 394,344 | 4.29 | 4,383 |
| 110-80 | 33,191 | 77 | 81,883 | 2.38 | 2,543 | 0.08 | 0.79 | 2.00 | 378 | 402,842 | 4.20 | 4,478 |
| 105-75 | 34,696 | 75 | 83,932 | 2.32 | 2,584 | 0.08 | 0.78 | 1.97 | 369 | 411,615 | 4.10 | 4,575 |
| 90-60 | 39,460 | 70 | 89,112 | 2.13 | 2,706 | 0.07 | 0.75 | 1.92 | 345 | 437,219 | 3.83 | 4,860 |
Figure 1 – Location of Zones Included in Boumadine MRE, with Drill Holes and Magnetic Data (Residual Total Field)
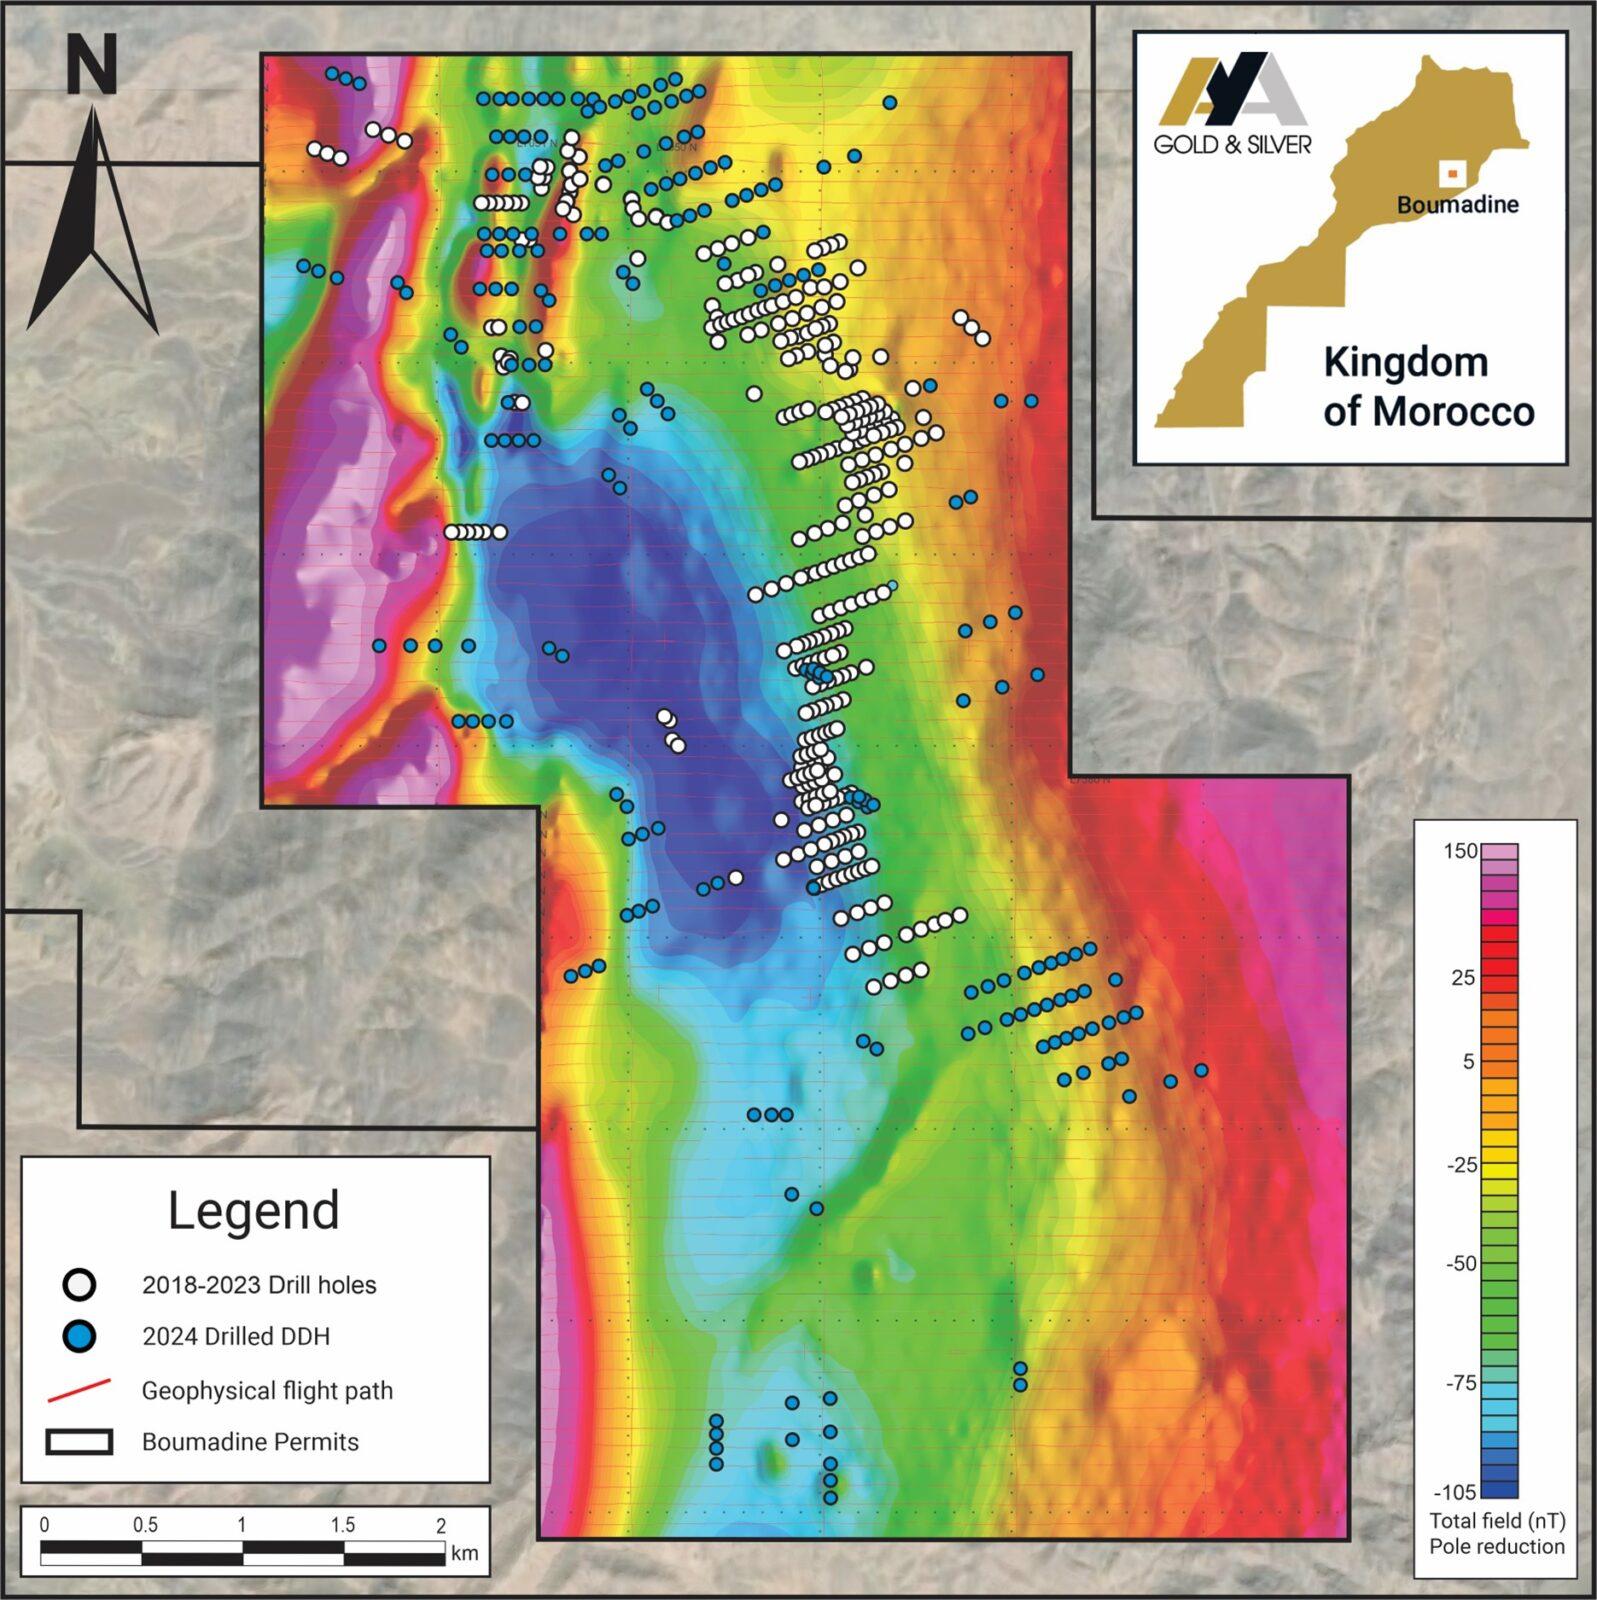
Figure 2 – Surface Plan of Boumadine with Mineralized Envelope Included in the MRE
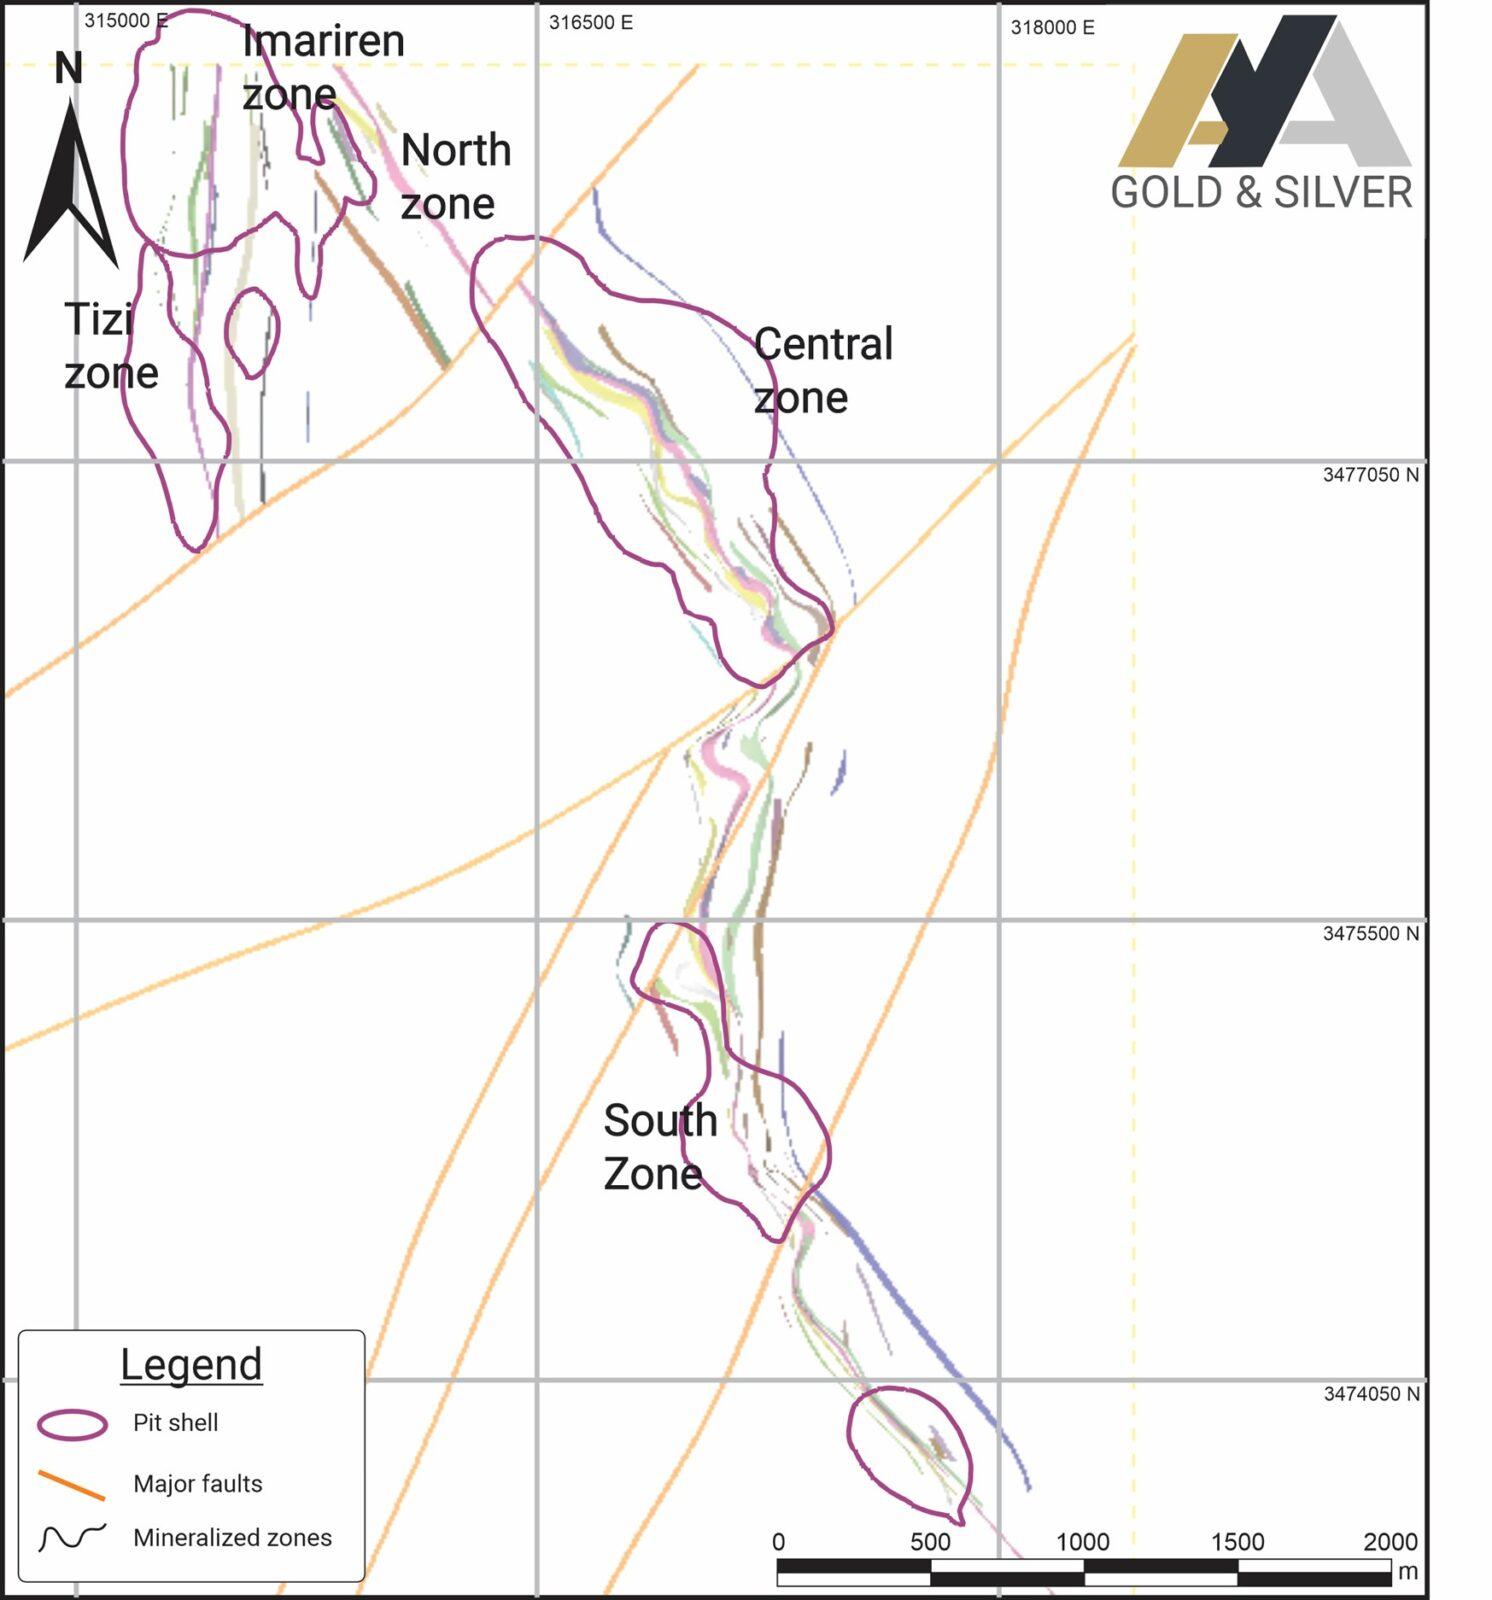
Figure 3 – Longitudinal Projection of the Block Model of Boumadine MRE
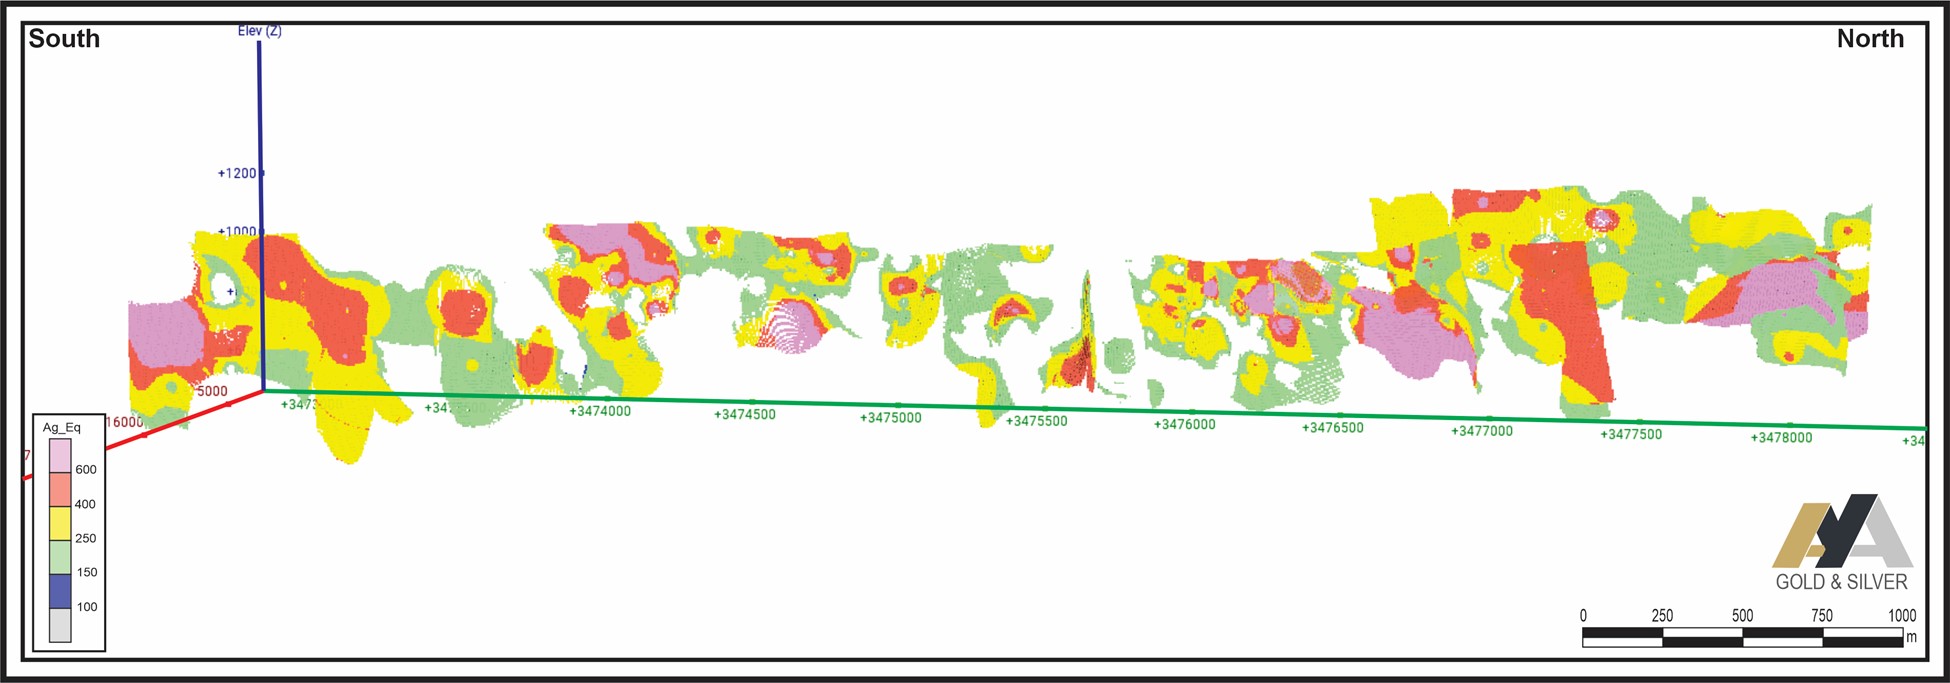
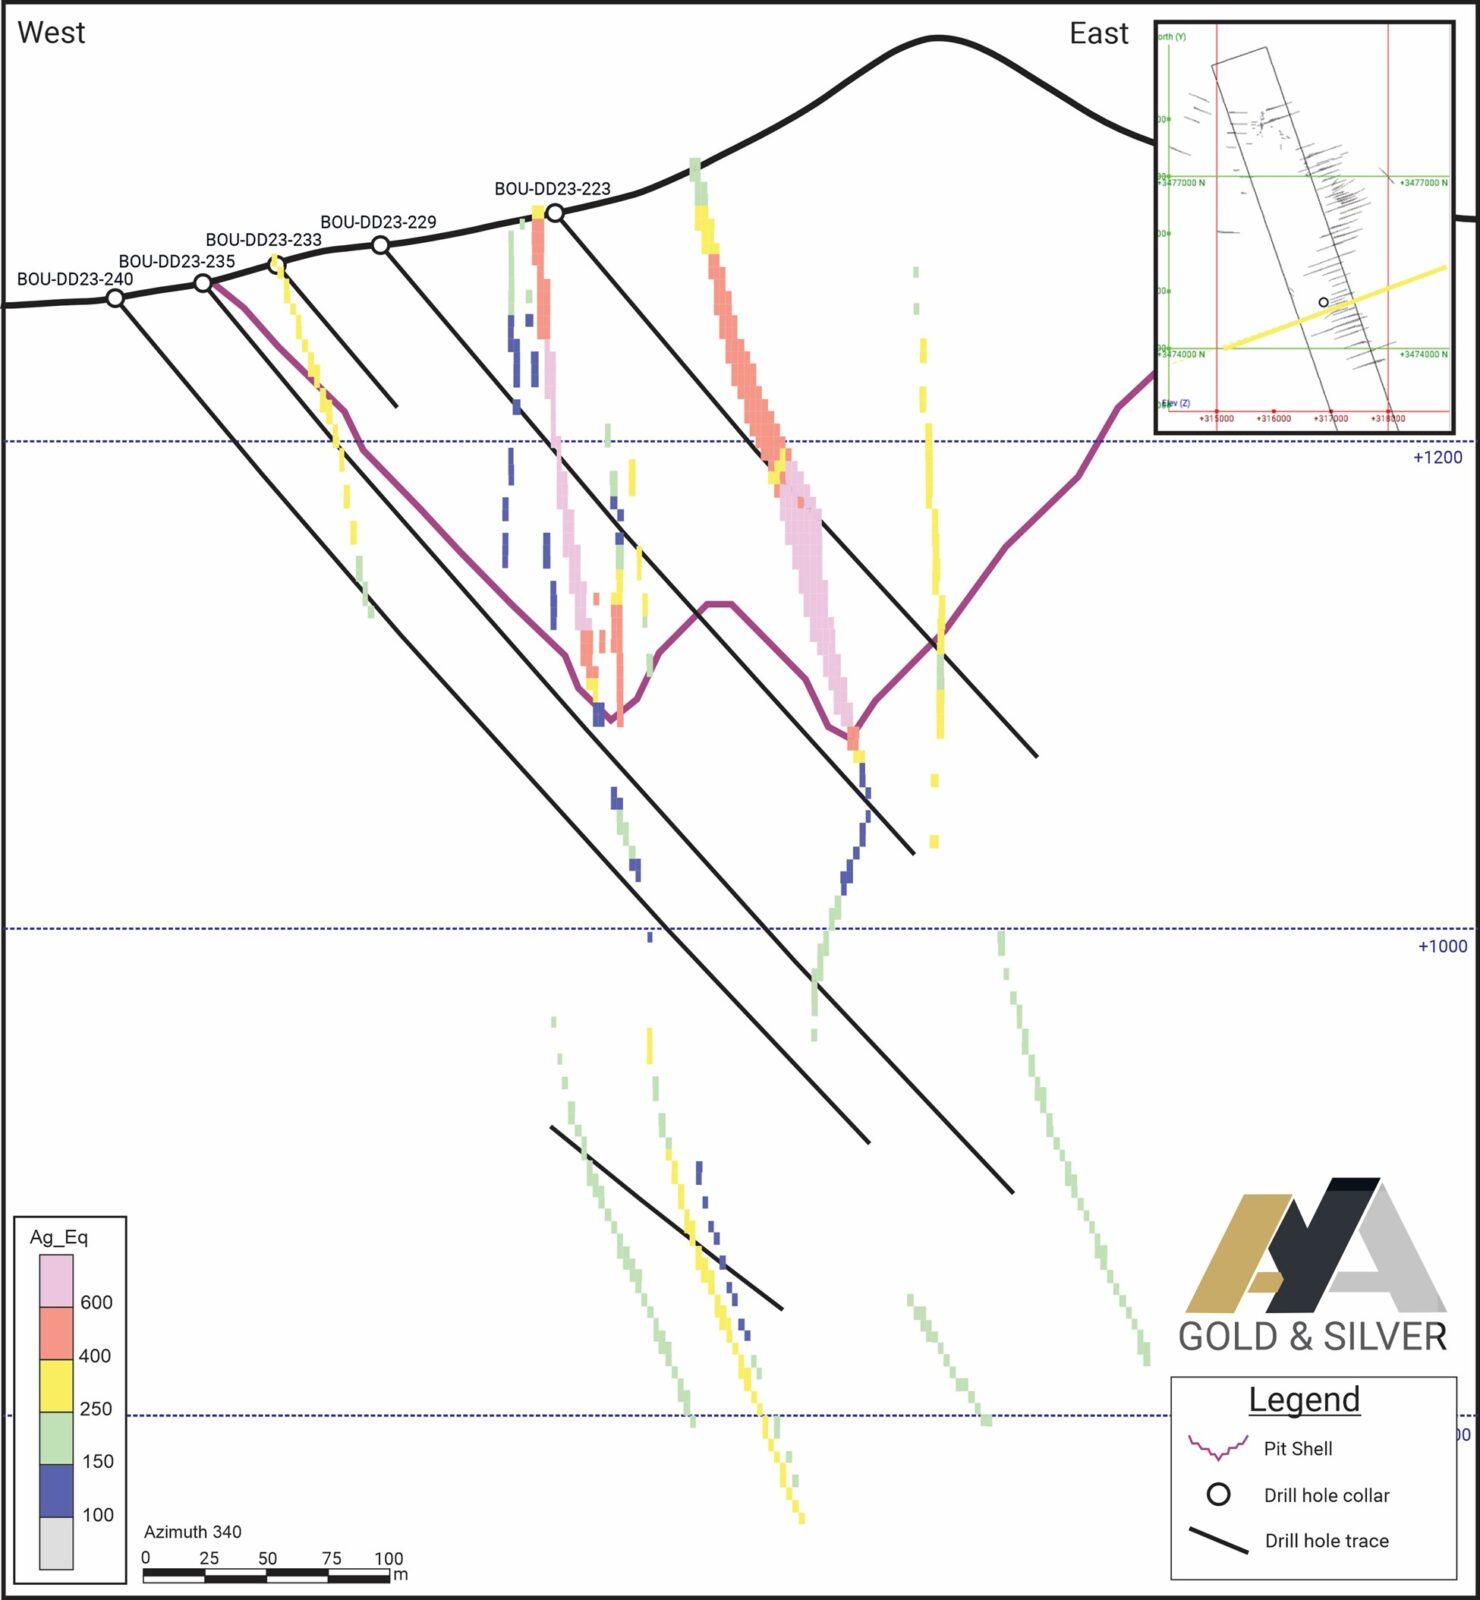
Figure 4 – Typical Vertical Cross-Section of the Boumadine Central Zone (Section 8850N)
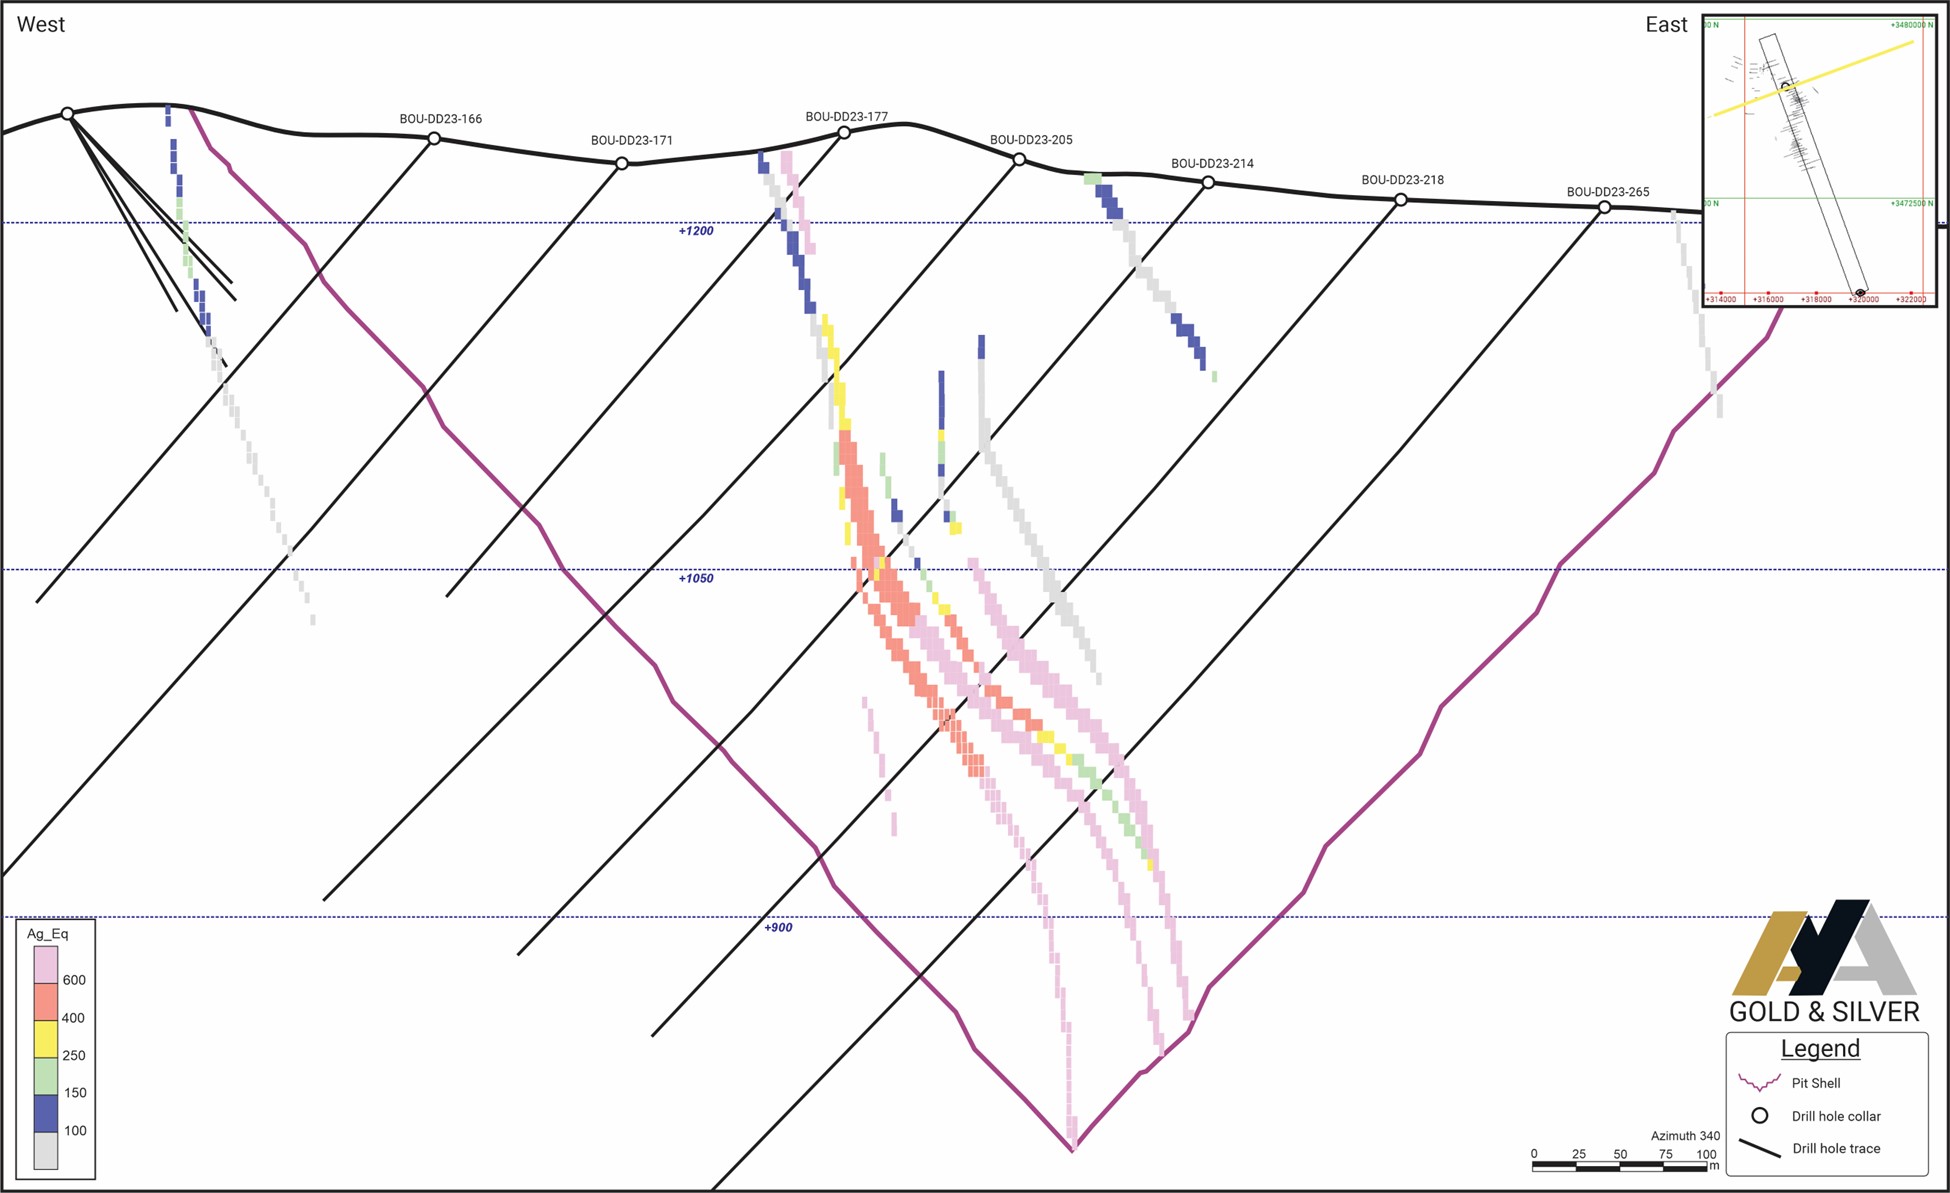
Figure 5 – Typical Vertical Cross-Section of the Boumadine South Zone (Section 6525N)
Resource-Supporting Information
Geology and Geological Interpretation
The Boumadine Project is located within the Anti-Atlas belt, on the northwest side of the Ougnat Massif. The geology of the Ougnat Inlier is formed by late-Precambrian (PIII) predominantly calc-alkaline volcanic and intrusive rocks. Mineralization is hosted within polymetallic massive Au-Ag-Zn-Pb sulphide vein systems oriented N340. Mineral assemblage is characterized by high concentration of pyrite and variable amounts of arsenopyrite, sphalerite, and galena with local trace of chalcopyrite. Veins are sub-vertical to steeply dipping (>70°) with thickness generally varying from 1m to 5m: locally reaching over 10m.
Mineralized boundaries for the current MRE have been determined using a combination of logged sulphide percentage and mineralization grade assay. 3D wireframes were created using interval selection with the Seequent software Leapfrog GeoTM.
Sampling and Sub-sampling Techniques
Only DDH samples were used for the Boumadine deposit MRE.
DDH were cut and sampled at nominal 1m lengths, except where lengths were altered to match geological boundaries. Sampling was undertaken along the entire length of the DDH. Circa 2-to-4-kilogram samples were submitted to the laboratory for analysis.
Sample Analysis Method
Samples were prepared by African Laboratory for Mining and Environment (“Afrilab”) at its Boumadine prep-laboratory facility or at its Zgounder prep-lab. A total of 250 grams (“g”) of pulverized sample material was then submitted for analysis to Afrilab Marrakech. Inductively Coupled Plasma spectrometry was used for Ag, Zn, Pb, Cu. Fire assaying was conducted for Au and Ag results above 200 g/t.
QA/QC samples were inserted at a 5% rate. For a batch of 25 samples: one certified reference material, one blank and one drill core duplicate were inserted. At the end of each month, a selection of 5% from the coarse rejects was submitted to Afrilab and a selection of 5% of the pulp residues was sent to ALS Sevilla, Spain acting as an umpire lab.
Regular reviews of the sampling and QA/QC protocols were carried out by Aya’s project geologist under the supervision of Aya’s Qualified Person, to ensure all procedures were followed and best industry practices carried out. Monitoring of results of duplicates, blanks and certified reference materials was conducted by the database administrator each time an assay batch was imported in the Geotic database.
Drilling Techniques
Drilling was carried out by Geosond Maroc SARL using CT20 and CS140 drill rigs; and by FTE Drilling using Versadrill and Marcotte rigs. DDH were drilled with HQ and NQ diameters. Down-hole surveys were completed in each hole with a first reading at 12.5m and then every 25m by reflex Ez-shot and Devico-deviflex. All drill hole collars were surveyed by a DGPS.
Drill and Data Spacing
Most of the deposit has been drilled on a 100m x 50m spacing grid through N70 cross-sections. In the northern and southern sections, the spacing was extended to 200m x 100m. The Indicated Mineral Resource was infilled to 50m x 50m grid spacing.
Mineral Resource and Estimation Methodology
84% of the Mineral Resource Estimate is classified as Inferred, and the remaining 16% in the Indicated category.
Data was composited to 1m. Top cuts were applied to Au, Ag, Zn, Pb, Cu after review of composite log-normal histograms.
Veins were interpolated independently by inverse square distance. Wireframe modelling was developed using Seequent Leapfrog GeoTM. Statistics, variography and estimations were completed using the Geovariances Isatis NeoTM software. Open-pit optimization was developed using the GEOVIA Whittle software.
Bulk density measurements were collected systematically within mineralized zones and outside boundaries of mineralized zones. Different bulk density values were allocated by veins based on the vein average bulk density value. Transitional materials were also allocated a different bulk density value.
Cut-off Grades
The geological domain boundaries were determined using a cut-off grade of 100 g/t Ag equivalent. Mineral Resources are reported using NSR values of US$125/t for the out-of-pit and US$95/t for the open-pit.
NSR, Ag equivalent and Au equivalent are calculated using the following parameters and formulas (Table 4).
Table 4 – Parameters and Formulas used to Calculate NSR, Ag Equivalents and Au Equivalents
| Au (oz) | Ag (oz) | Zn (lb) | Pb (lb) | Cu (lb) | |
| Prices in $USD | $2,200 | $24 | $1.20 | $1.00 | $4.00 |
| Recovery in % | 85.2% | 89.1% | 72.0% | 84.5% | 75.3% |
| NSR ($/t) | (Pb% x $10.74) + (Zn% x $13.58) + (Au g/t x $58.97) + (Ag g/t x $0.64) + (Cu% x 63.08) |
||||
| Ag Equivalent (g/t) |
Ag(g/t) + (Au(g/t) *Au price/oz*Au recovery)/(Ag price/oz*Ag recovery) + Zn(%)*Zn price/lb* Zn recovery/(Ag price/oz*Ag recovery)*685.7147973 + Pb(%)*Pb price/lb* Pb recovery/(Ag price/oz*Ag recovery)*685.7147973 + Cu(%)*Cu price/lb* Cu recovery/(Ag price/oz*Ag recovery)*685.7147973 |
||||
| Au Equivalent (g/t) |
Au(g/t) + (Ag(g/t) *Ag price/oz*Ag recovery)/(Au price/oz*Au recovery) + Zn(%)*Zn price/lb* Zn recovery/(Au price/oz*Au recovery)*685.7147973 + Pb(%)*Pb price/lb* Pb recovery/(Au price/oz*Au recovery)*685.7147973 + Cu(%)*Cu price/lb* Cu recovery/(Au price/oz*Au recovery)*685.7147973 |
||||
Mining and Metallurgical Parameters
The mineralization at Boumadine starts at surface and continues down to more than 600m in depth, making the MRE appropriate for a combination of open pit and underground mining.
Mining dimensions or mining dilution were not considered as part of the pit optimization work, and a block dimension of 2.5m x 5m x 5m was used, which is considered acceptable in terms of a potential smaller selective mining unit. Similarly, a crown pillar has not been accounted for between the open pit and the underground mineral resources.
The preliminary metallurgical recoveries that have been used for the NSR calculation are presented (Table 4) along with the NSR calculation formula, and are 85.2% for Au, 89.1% for Ag, 72% for Zn, 84.5% for Pb, and 75.3% for Cu.
The NSR US$/t value was based on estimated metallurgical recoveries derived from a series of testwork, assumed metal prices, and smelter terms, which include payable factors, treatment charges, penalties, and refining charges.
Next Steps
Prior to 2020, the Boumadine Project had seen limited near-mine drilling and no regional exploration. Since 2022, the Aya team has conducted over 140,000 m of DDH programs on the mining permit with the goal of delivering a MRE.
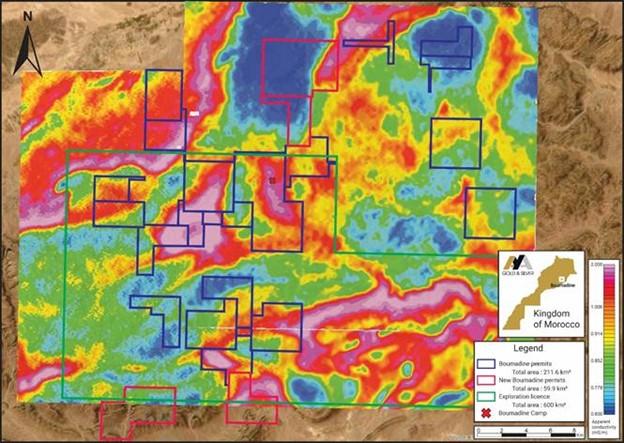
Significant upside potential exists to expand the Boumadine Main Trend, which currently covers 5.4km of strike length and remains open in all directions. Through 2025, the Corporation plans to mobilize eleven diamond and three reverse circulation drill rigs to complete the 140,000m drilling program. Half of the program will test the continuation of the known trends (Boumadine and Tizi) and infill. The remaining 50% will focus on geological targets generated by previous work and will be informed by the hyperspectral survey, high-resolution geophysical survey and the mapping and prospecting campaigns. As the MobileMT survey shows, there is a strong relation between apparent conductivity and Boumadine type mineralization. A total of 24 new permits have been acquired in the vicinity of the Boumadine permits since June 2023 (Figure 6). The results from ongoing geology work will determine additional development work.
Figure 6 – Location of New Boumadine Permits Overlayed with Apparent Conductivity at 175Hz
Qualified Person
The scientific and technical information contained in this press release have been reviewed and approved by David Lalonde, B. Sc, Vice-President of Exploration, Qualified Person, and by Patrick Pérez, P.Eng., Director, Technical Services, Qualified Person.
This Mineral Resource Estimate has been completed in accordance with NI 43-101, and the Corporation will prepare and file a Technical Report on SEDAR+ within 45 days of this press release.
About Aya Gold & Silver Inc.
Aya Gold & Silver Inc. is a rapidly growing, Canada-based silver producer with operations in the Kingdom of Morocco.
The only TSX-listed pure silver mining company, Aya operates the high-grade Zgounder Silver Mine and is exploring its properties along the prospective South-Atlas Fault, several of which have hosted past-producing mines and historical resources.
Aya’s management team maximizes shareholder value by anchoring sustainability at the heart of its production, resource, governance, and financial growth plans.
Combined company expected to produce 1.1 million ounces of gold a... READ MORE
Viva Gold Corp (TSX-V: VAU) (OTCQB: VAUCF) is pleased t... READ MORE
Panoro Minerals Ltd. (TSX-V:PML) (BVL: PML) (FSE: PZM) (OTCQB: PO... READ MORE
Gold X2 Mining Inc. (TSX-V: AUXX) (OTCQB: GSHRF) (FWB: DF... READ MORE
Hole 26MN-075 returned: 11.84 g/t gold over 8.39 metres (“m... READ MORE


