


32% Increase in the Indicated Resource to 1,538,000 Ounces of Gold
95% Increase in the Inferred Resource to 458,000 Ounces of Gold
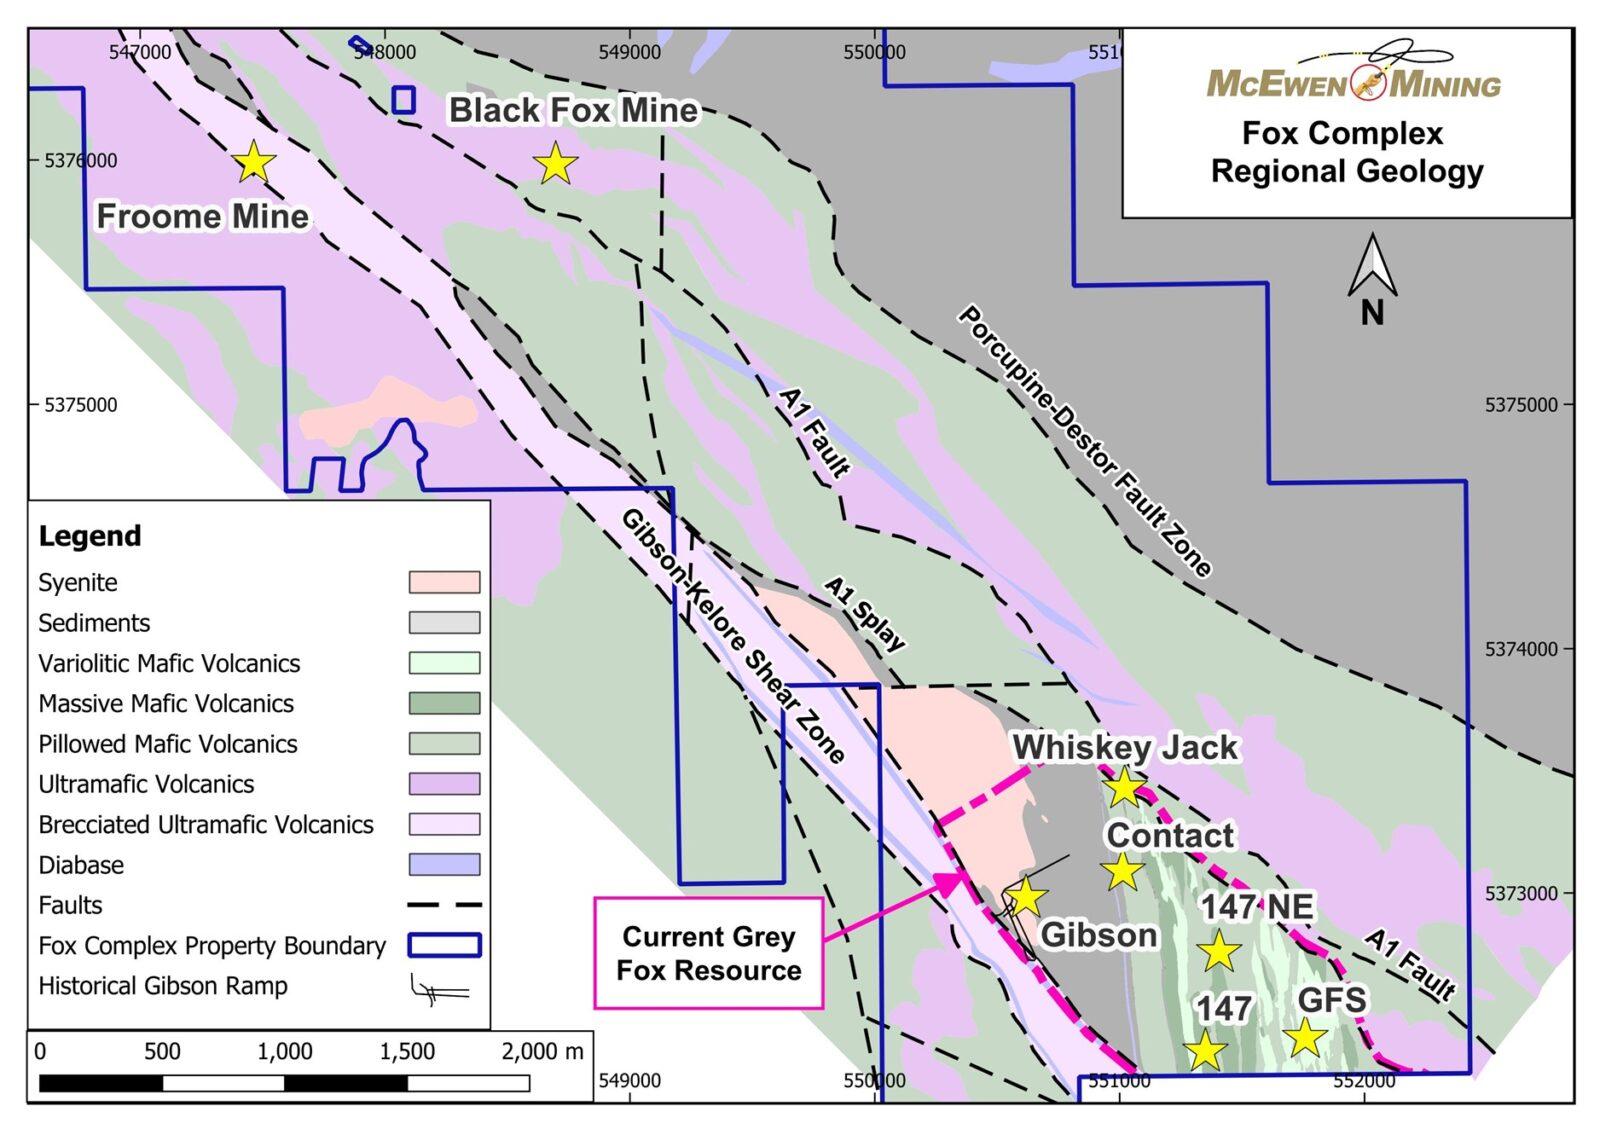
McEwen Mining Inc. (NYSE: MUX) (TSX: MUX) is pleased to report a significant increase in the estimated gold resources at the Fox Complex’s Grey Fox deposit to December 31st, 2024, compared to the last estimate in the 2021 Fox Complex PEA (refer to Table 1). The discovery cost of this increase was US $14.46 per ounce (oz). The deposit itself is subdivided into six different zones: Contact, 147, 147 NE, Grey Fox South (GFS), Gibson & Whiskey-Jack (WJ), shown as yellow stars in Figure 1. An intriguing historic public government record reports that a bulk sample of 8,000 tonnes taken in 1989 from the Gibson zone ramp yielded an average grade in excess of 27 g/t gold. Mineralization at Grey Fox is in close proximity to the highly prolific Porcupine-Destor fault, which historically has been associated with the production of some 110 million ounces of gold. A complete update of the mineral resources at the Fox Complex will be published in the coming weeks.
The increase in resources at Grey Fox can be attributed to a number of factors: exploration drilling discovering and extending new and existing gold lenses; a higher gold price used to calculate the resource, from US$1,750, used in 2021 to US$2,000 today that allowed for a lower cut-off grade, from 2.30 g/t Au to 1.60 g/t Au, which also benefited from foreign exchange rates, used in the evaluation of potential underground mining scenario shapes.
Rob McEwen, Chairman and Chief Owner, said, “Our investment in exploration on the Fox Complex properties has successfully expanded our gold resources, which will enable us to both increase annual production and extend the mine life. Grey Fox is one of several exploration targets contributing to the growth of gold resources and enhancing the future production at our Fox Complex.”
Table 1. Grey Fox Mineral Resource Update
| Grey Fox Mineral Resource Update as of December 31st, 2024 | ||||
| Resource | Cut-off Grade | Quantity | Grade Gold | Contained Metal |
| Classification | Gold (g/t) | (‘000 t) | (g/t) | Gold (oz) |
| Measured | 1.60 | – | – | – |
| Indicated | 1.60 | 13,135 | 3.64 | 1,538,000 |
| Total Measured + Indicated | 1.60 | 13,135 | 3.64 | 1,538,000 |
| Inferred | 1.60 | 4,319 | 3.30 | 458,000 |
| Total Inferred | 1.60 | 4,319 | 3.30 | 458,000 |
The Grey Fox deposit is located approximately 3 kilometers South-East of McEwen Mining’s Black Fox Mine and about 75 kilometers East of Timmins, Ontario, Canada (see Figure 1). The geology of the Fox Complex shown in Figure 1 is highly favourable for structurally controlled gold mineralization principally due its proximity to the world-class Porcupine-Destor Fault Zone and subordinate splay faults such as the A-1 and Gibson-Kelore. In addition, there is a large intrusive porphyry (syenite) body at Grey Fox which could also have been a ‘heat-engine’ for much of the gold mineralization. Current geological modeling of Grey Fox by McEwen Mining indicates the presence of over 150 distinct mineralized lenses in an area of about 1.4 square kilometers, with many of the lenses extending to the bedrock surface. The high concentration of lenses in such a compact area may indicate a robust mineralized system at Grey Fox. This is especially evidenced at the Gibson zone, where our drilling has confirmed mineralization from near surface (<25 m) down to vertical depths exceeding 800 m. In addition, the majority of these mineralized lenses remain open at depth.
Figure 1. Plan View Map of the Eastern Fox Complex
Referring to Table 2 below it can be seen that the 2024 resource update resulted in an increase (compared to the 2021 PEA) in contained gold for all six zones, for both the Indicated and Inferred categories. Of particular interest are the increases at Gibson because of the historical Gibson Ramp which, when recommissioned, could provide access for early production ounces from Grey Fox. Gibson’s Indicated resource increased 181% from 139,000 oz to 290,000 oz gold and its Inferred resource increased 80% from 125,000 oz to 245,000 oz gold.
Table 2. Comparison by Zone Between the 2021 PEA Resource and the December 31st, 2024 Resource Update
| Classification | Zone | Quantity (‘000 t) | Grade Gold (g/t) | Contained Metal – Gold (oz) | |||||||||
| PEA 2021 |
Dec 2024 |
% Change |
PEA 2021 |
Dec 2024 |
% Change |
PEA 2021 |
Dec 2024 |
% Change |
|||||
| Indicated | Contact Zone | 2,346 | 3,449 | 47 | % | 5.06 | 3.61 | -20 | % | 382,000 | 400,000 | 47 | % |
| 147 Zone | 1,952 | 3,159 | 62 | % | 4.89 | 3.85 | -15 | % | 307,000 | 391,000 | 59 | % | |
| 147NE Zone | 863 | 1,247 | 44 | % | 5.40 | 4.01 | -19 | % | 150,000 | 161,000 | 17 | % | |
| South Zone | 1,267 | 1,547 | 22 | % | 4.69 | 3.62 | -24 | % | 191,000 | 180,000 | 31 | % | |
| Gibson Zone | 1,137 | 3,097 | 172 | % | 3.79 | 2.91 | -20 | % | 139,000 | 290,000 | 181 | % | |
| WJ Zone | – | 636 | – | – | 5.69 | – | – | 116,000 | – | ||||
| Inferred | Contact Zone | 259 | 609 | 135 | % | 4.58 | 3.34 | -23 | % | 38,000 | 65,000 | 97 | % |
| 147 Zone | 246 | 532 | 116 | % | 4.85 | 4.23 | -21 | % | 38,000 | 72,000 | 78 | % | |
| 147NE Zone | 64 | 120 | 88 | % | 7.51 | 5.28 | -23 | % | 15,000 | 20,000 | 16 | % | |
| South Zone | 135 | 460 | 241 | % | 4.38 | 3.52 | -24 | % | 19,000 | 52,000 | 39 | % | |
| Gibson Zone | 982 | 2,587 | 164 | % | 3.95 | 2.94 | -24 | % | 125,000 | 245,000 | 80 | % | |
| WJ Zone | – | 11 | – | – | 9.40 | – | – | 3,000 | – | ||||
Also noteworthy to mention is that the resource for the Whiskey-Jack (WJ) zone is categorized as 97% Indicated mineralization with 116,000 oz gold at a grade of 5.7 g/t Au. The WJ zone possesses the greatest average true widths (5 to 7 meters) and the highest grade of any zone at Grey Fox. This zone is situated only 350 meters away from the entrance to the Gibson Ramp (see Press Release dated December 2nd, 2024) and if this ramp is used, WJ could also be a potential early mining horizon at Grey Fox.
The discovery cost per ounce of gold (since the 2021 PEA resource estimate) was US $14.46. This low cost is principally due to intercepting multiple lenses of mineralization, often with a single drillhole, and to the Exploration team’s optimized drill programs, which resulted from continued improvements to the geological understanding of the Grey Fox deposit.
Table 3 provides a comparison of the 2021 PEA resource estimate with the December 31st, 2024 resource update. The decrease in grade reflects the lower cut-off used in the calculation of mineral resources using potential underground mining scenario shapes due to an increase in the gold price used, which has risen from US$ 1,725/oz Au to US$ 2,000/oz Au. This is more than offset by the extension of existing lenses and the discovery of new ones, adding new tonnes and ounces to the resource.
Table 3. Comparison of the 2021 PEA Resource Estimate to the Year-End 2024 Resource Estimate
| PEA 2021 | ||||
| Classification | Cut-off Grade | Quantity | Grade Gold | Contained Metal |
| Gold (g/t) | (‘000 t) | (g/t) | Gold (oz) | |
| Measured Resource | 2.30 | – | – | – |
| Indicated Resource | 2.30 | 7,566 | 4.80 | 1,168,000 |
| Total Measured + Indicated | 2.30 | 7,566 | 4.80 | 1,168,000 |
| Inferred Resource | 2.30 | 1,685 | 4.36 | 236,000 |
| Total Inferred | 2.30 | 1,685 | 4.36 | 236,000 |
| Grey Fox Mineral Resource Update as of December 31st, 2024 | ||||
| Classification | Cut-off Grade | Quantity | Grade Gold | Contained Metal |
| Gold (g/t) | (‘000 t) | (g/t) | Gold (oz) | |
| Measured Resource | 1.60 | – | – | – |
| Indicated Resource | 1.60 | 13,135 | 3.64 | 1,538,000 |
| Total Measured + Indicated | 1.60 | 13,135 | 3.64 | 1,538,000 |
| Inferred Resource | 1.60 | 4,319 | 3.30 | 458,000 |
| Total Inferred | 1.60 | 4,319 | 3.30 | 458,000 |
| Changes in the Elements of the Resource Estimation – December 31st, 2024 versus PEA 2021 | ||||
| Classification | Quantity | Grade Gold | Contained Metal | |
| (‘000 t) | (g/t) | Gold (oz) | ||
| Measured Resource | – | – | – | |
| Indicated Resource | 74% | -24% | 32% | |
| Total Measured + Indicated | 74% | -24% | 32% | |
| Inferred Resource | 156% | -25% | 95% | |
| Total Inferred | 156% | -25% | 95% | |
Technical Information
Technical information pertaining to the Fox Complex exploration contained in this news release has been prepared under the supervision of Sean Farrell, P.Geo., Exploration Manager, who is a Qualified Person as defined by Canadian Securities Administrators National Instrument 43-101 “Standards of Disclosure for Mineral Projects.”
The technical information related to resource and reserve estimates in this news release has been reviewed and approved by Luke Willis, P.Geo., McEwen Mining’s Director of Resource Modelling and is a Qualified Person as defined by SEC S-K 1300 and Canadian Securities Administrators National Instrument 43-101 “Standards of Disclosure for Mineral Projects.”
Footnotes to Tables 1-3
ABOUT MCEWEN MINING
McEwen Mining Inc. is a gold and silver producer with operations in Nevada (USA), Canada, Mexico, and Argentina. The company also owns 46.4% of McEwen Copper, which develops the large, advanced-stage Los Azules copper project. Los Azules aims to become Argentina’s first regenerative copper mine and is committed to achieving carbon neutrality by 2038.
Focused on enhancing productivity and extending the life of its assets, the Company’s goal is to increase its share price and provide investor yield. Rob McEwen, Chairman and Chief Owner, has a personal investment in the companies of US$225 Million. His annual salary is US$1.
CPM Group’s 10-Year Copper Outlook are now available. ... READ MORE
Arizona Gold and Silver Inc. (TSX-V: AZS) (OTCQB: AZASF) is ple... READ MORE
Brixton Metals Corporation (TSX-V: BBB) (OTCQX: BBBXF) is pleased... READ MORE
Valkea Resources Corp. (TSX-V: OZ) is pleased to announce the clo... READ MORE
Tiger Gold Corp. (TSX-V: TIGR) (FSE: D150) (OTCQB: TGRGF) is plea... READ MORE


