GoGold Announces Results of Los Ricos South Feasibility Study with After Tax NPV of US$355M
GoGold Resources Inc. (TSX: GGD) (OTCQX: GLGDF) is pleased to release the results of its Feasibility Study at its Los Ricos South Project located in Jalisco State, Mexico. The FS includes a re-engineered 2,000 tonne per day underground mine plan compared to the Preliminary Economic Assessment which was released in September 2023 and incorporates an updated Mineral Resource Estimate.
Ausenco Engineering Canada ULC completed the design and cost estimates for the process plant. The exercise also included a Front-End Engineering & Design component which provided more engineering detail on key vendor supply packages. This component is beyond the normal Feasibility Study level of detail and adds greater technical and engineering data to these specific aspects of the plant design. The FEED component is expected to allow for a quicker transition to the detailed engineering and field execution phases in the future.”
Highlights of the FS, with a silver price of US$26.80/oz, gold price of US$2,330/oz and copper price of US$4.00/lb are as follows (all figures in US dollars unless otherwise stated):
- After-Tax net present value (using a discount rate of 5%) of US$355 million with an After-Tax IRR of 28% (Base Case);
- At approximate spot metal silver price of $30/oz and gold price of $2,608/oz, NPV (using a discount rate of 5%) of US$469 million with an After-Tax IRR of 34%;
- 15-year mine life producing a total of 80 million payable silver equivalent ounces (“AgEq”), consisting of 41 million silver ounces, 424 thousand gold ounces, and 11 million pounds of copper;
- Initial capital costs of $227 million, including $21 million in contingency costs, over an expected two year build, and sustaining capital costs of $100 million over the life of mine;
- Average operating cash costs of $9.94/oz AgEq, and all in sustaining costs of $11.19/oz AgEq over first 5 years of production, with average AISC of $12.32/oz AgEq over the underground mine life;
- Average annual production of 7.3 million AgEq oz over first 5 years;
- Successful conversion of Mineral Resources to Proven and Probable Mineral Reserves totalling 10.2 million tonnes grading 276 g/t AgEq containing 91 million ounces AgEq, including 7.5 million underground tonnes grading 326 g/t AgEq;
- Average underground mining width of 11 metres using bulk mining method of longitudinal sub-level long-hole mining;
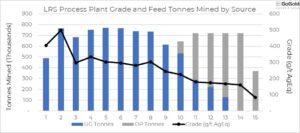
Figure 2 – LRS Process Plant Grade and Feed Tonnes Mined by Source (CNW Group/GoGold Resources Inc.)
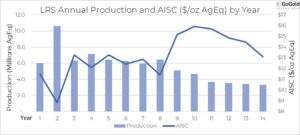
Figure 3 – LRS Annual Production (AgEq oz ore feed) and AISC ($/oz AgEq) by Year (CNW Group/GoGold Resources Inc.)
“This FS has a very high level of detail, exceeding the normal feasibility study level of detail in the process plant design. Our expectation is that we will receive a positive outcome on our permit application for our underground mine by the end of March 2025. The Company has a strong balance sheet and we are in advanced discussions with prospective lenders for the remaining financing required for construction. With this detailed study and once we have obtained the permit, we should be able to formally make a construction decision and begin building the mine,” said Brad Langille, President and CEO. “We have the support of the local community for the project and have begun the process of building our mining and technical services team. Looking beyond the imminent construction, we also see the opportunities for more near mine exploration with a focus on growing more high grade underground resources in Los Ricos South and also look to advance Los Ricos North in 2025.”
An NI 43-101 Technical Report will be filed on SEDAR+ within 45 days of this news release containing the full details of the FS.
Table 1 – LRS FS Underground Key Assumptions and Results
| Assumption / Result | Unit | Value | Assumption / Result | Unit | Value | |
| Total UG Ore Mined | kt | 7,512 | UG Mining Costs | $/t Plant Feed | 44.04 | |
| UG Silver Grade1 | g/t | 170 | Operating Cash Cost | $/oz AgEq | 11.22 | |
| UG Gold Grade1 | g/t | 1.65 | All in Sustaining Cost | $/oz AgEq | 12.32 | |
| UG AgEq Grade1 | g/t | 326 | Mine Life | Yrs | 12 | |
| Silver Recovery | % | 86 | Average Mining Width | m | 11 | |
| Gold Recovery | % | 93 |
- Grades shown are LOM average process plant feed grades including underground external dilution of approximately 18%
- The underground mining method is longitudinal sub-level long-hole mining.
- AgEq includes gold converted at a ratio of 86.05:1 and copper % converted at a ratio of 103.4:1.
Table 2 – LRS FS Life of Mine Key Assumptions and Results
| Assumption / Result | Unit | Value | Assumption / Result | Unit | Value | |
| Total Plant Feed Mined | kt | 10,233 | Net Revenue | $M | 2,099 | |
| Average process rate | t/day | 2,000 | Initial Capital Costs | $M | 227 | |
| Silver Recovery | % | 86 | Sustaining Capital Costs | $M | 100 | |
| Gold Recovery | % | 93 | Mining Costs | $/t Plant Feed | 42.92 | |
| Silver Price | $/oz | 26.80 | Processing Costs | $/t Plant Feed | 39.63 | |
| Gold Price | $/oz | 2,330 | General and Admin Costs | $/t Plant Feed | 6.88 | |
| Copper Price | $/lb | 4.00 | Operating Cash Cost | $/oz AgEq | 11.59 | |
| Payable Silver Metal | Moz | 41.1 | All in Sustaining Cost | $/oz AgEq | 12.78 | |
| Payable Gold Metal | koz | 423.6 | After-Tax NPV (5% discount) | $M | 355 | |
| Payable Copper | Mlb | 11.2 | Pre-Tax NPV (5% discount) | $M | 553 | |
| Payable AgEq1 | Moz | 79.9 | After-Tax IRR | % | 28.0 | |
| Mine Life | Yrs | 15 | Pre-Tax IRR | % | 38.6 | |
| After-Tax Payback Period | Yrs | 2.6 |
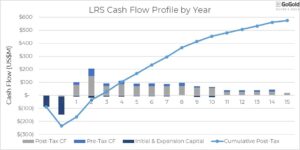
Figure 1 above highlights the excellent post-tax cash flows associated with the LRS Project. The economics of the Project have been evaluated based on the base case scenario $26.80/oz silver price, gold price of $2,330/oz and copper price of $4.00/lb. As illustrated in the following sensitivity tables, the Project remains robust even at lower commodity prices or with higher costs.
The Project mine plan is primarily underground, with a 12 year underground mine life engineered, followed by an open pit mine which begins in the 10th year.
Table 3 – LRS FS Gold and Silver Price Sensitivities
| Sensitivity | Base Case |
||||||
| Silver Price ($/oz) | 20 | 22 | 24 | 26.80 | 30 | 33 | 36 |
| Gold Price ($/oz) | 1,739 | 1,913 | 2,087 | 2,330 | 2,608 | 2,869 | 3,130 |
| After-Tax NPV (5%) ($M) | 110 | 184 | 255 | 355 | 469 | 575 | 681 |
| After-Tax IRR (%) | 13.6 | 18.3 | 22.5 | 28.0 | 33.7 | 38.8 | 43.7 |
| After-Tax Payback (years) | 4.7 | 3.8 | 3.2 | 2.6 | 2.0 | 1.8 | 1.7 |
Table 4 – LRS FS Operating Cost and Capital Cost Sensitivities
| Sensitivity | -20 % | -10 % | Base Case |
10 % | 20 % |
| Operating Costs – NPV ($M) | 440 | 399 | 355 | 317 | 275 |
| Operating Costs – IRR (%) | 32.6 | 30.6 | 28.0 | 26.3 | 24.1 |
| Capital Costs – NPV ($M) | 394 | 373 | 355 | 331 | 310 |
| Capital Costs – IRR (%) | 35.1 | 30.9 | 28.0 | 24.5 | 22.0 |
FS Summary
The LRS Project has been envisioned as an underground mining operation for the first ten years, with contract underground mining supplying a 2,000 tonne per day process plant.
The FS was prepared by independent consultants P&E Mining Consultants Inc acting as lead consultant and completing the MRE, Mineral Reserves, and mining. Additional contributing consultants and their roles were as follows:
- Ausenco – Process plant & infrastructure
- SGS Canada Inc.’s Lakefield office – Metallurgical
- WSP – Underground and Open Pit Geotechnical
- CIMA – Environmental
- Paterson & Cooke – Paste backfill
- BQE / D.E.N.M. Engineering – SART design & costing
- BCG – Tailings geotechnical
Table 5 – LOM Capital Cost Estimate
| Type | Initial
($k) |
Sustaining
($k) |
Total
($k) |
| Process Plant direct costs | 83,544 | 10,223 | 93,767 |
| Underground development | 51,054 | 62,763 | 113,817 |
| Open pit stripping | 17,661 | 17,661 | |
| Infrastructure | 38,558 | 38,558 | |
| EPCM | 17,969 | 17,969 | |
| Project indirect costs | 14,576 | 14,576 | |
| Total | 205,701 | 90,647 | 296,348 |
| Contingency (10%) | 20,987 | 9,065 | 30,052 |
| Grand Total | 226,688 | 99,712 | 326,400 |
Table 6 – Operating Costs (Average LOM)
| Operating Costs (Average LOM) | $/tonne
Plant Feed |
$/tonne Mined |
| Open Pit Mining | 17.72 | 2.64 |
| Underground Mining1 | 49.92 | |
| Total LOM Mining2 | 42.92 | |
| Processing ($/t processed) | 39.63 | |
| General and Admin ($/t processed) | 6.88 | |
| Total ($/t processed) | 89.43 |
- Bulk underground long hole mining. $44.04 is the mining cost, $5.88 is cemented paste backfill, and additional development costs of $8.35/t mined are included in sustaining capital in table 6, providing a total UG mining cost of $58.27/t.
- Average LOM mining cost of both open pit and underground.
Mining
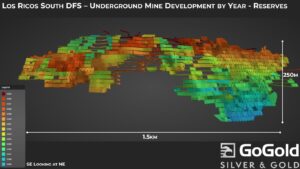
Contract underground mining will be completed using the longitudinal sub-level long-hole mining method and cemented paste back filling of the mined-out stopes. Approximately 10% of the underground ore will be sourced in close proximity to historical workings.
Process Plant Design
The process plant is comprised of conventional crushing and grinding followed by cyanide tank leaching. Back-end filtration is required to maximize water recycling (dry stack tailings) as well as a SART (sulfidation, acidification re-neutralization and thickening) circuit to recover cyanide back to the process and to produce a saleable copper sulfide product. The process plant will produce saleable silver-gold doré bars and a copper precipitate.
Metallurgy
In support of the feasibility study on the Los Ricos South deposits, an extensive metallurgical test program was completed at SGS Lakefield on representative drill core from the deposit. The program was designed to test and validate the key components of the process to confirm process plant performance including:
- Crushing and grinding
- Thickening and filtration
- Cyanide leaching and reagent consumptions
- SART performance
- Merrill Crowe (zinc precipitation)
- Dry-stack tailings detoxification and dewatering (maximizing water recovery)
Based on the extensive program, and life of mine mill simulation, the process plant will use a conventional whole ore leaching process and simple flow sheet to produce silver-gold doré bars and a copper precipitate. The cyanide leaching process recoveries range from 92 to 93% for gold and 85 to 87% for silver. Approximately 70% of the copper was also leached.
Dewatered and detoxified tailings were tested at Paterson and Cook in Sudbury, Ontario to determine the paste backfill cement addition rate for the underground mine and to minimize process water usage. The advantages of using underground paste backfill include maximized stability of the mine and the ability to store a majority of the process plant tailings as cemented paste underground, reducing surface impact.
Infrastructure
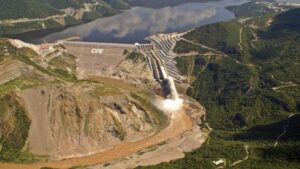
The Company has an agreement in place with the Comision Federal de Electricidad, which has secured an adequate power supply for LRS. Electricity for the Project is sourced from the nearby La Yesca hydroelectric dam.
The Company has also secured the rights to the land where the process plant will be located. Agreements were entered into with multiple farmers and stakeholders providing compensation for the usage of the required land. Agreements are also in place with the local Ejido which owns the surface rights over all of those concessions included in this FS.
Mineral Reserves and Mineral Resource Estimate
The basis for the FS is an inaugural Proven and Probable Mineral Reserve estimate totalling 10.2 million tonnes grading 275.7 g/t AgEq (145.4 g/t Ag, 1.39 g/t Au, and 0.10% Cu) containing 90.7 million ounces AgEq (47.8 Moz Ag, 457 Koz Au, 23.8 Mlb Cu), reflecting the successful conversion of Mineral Resources. A summary of the Mineral Reserves is provided in Table 7 and an updated Mineral Resource Estimate is provided in Table 8.
Table 7: Los Ricos South Mineral Reserve(1-8)
| Classification | Tonnage | Average Grade | Contained Metal | ||||||
| Ag | Au | Cu | AgEq | Ag | Au | Cu | AgEq | ||
| (kt) | (g/t) | (g/t) | ( %) | (g/t) | (koz) | (koz) | (Mlb) | (koz) | |
| Underground | |||||||||
| Proven | 3,902 | 187.1 | 1.61 | 0.09 | 334.3 | 23,472 | 202 | 7.5 | 41,939 |
| Probable | 3,611 | 152.0 | 1.70 | 0.18 | 317.8 | 17,647 | 197 | 14.6 | 36,895 |
| Subtotal Underground | 7,512 | 170.2 | 1.65 | 0.13 | 326.4 | 41,119 | 399 | 22.1 | 78,834 |
| Open Pit | |||||||||
| Proven | 580 | 94.8 | 0.72 | 0.02 | 159.0 | 1,768 | 13 | 0.3 | 2,965 |
| Probable | 2,140 | 72.1 | 0.64 | 0.03 | 129.7 | 4,961 | 44 | 1.4 | 8,924 |
| Subtotal Open Pit | 2,720 | 76.9 | 0.66 | 0.02 | 135.9 | 6,728 | 57 | 1.7 | 11,889 |
| Total | |||||||||
| Proven | 4,482 | 175.2 | 1.49 | 0.08 | 311.6 | 25,240 | 215 | 7.7 | 44,904 |
| Probable | 5,751 | 122.3 | 1.31 | 0.13 | 247.8 | 22,607 | 241 | 16.1 | 45,819 |
| Total Proven & Probable | 10,233 | 145.4 | 1.39 | 0.10 | 275.7 | 47,847 | 457 | 23.8 | 90,723 |
- Mineral Reserves are based on Measured and Indicated Mineral Resource Classifications only.
- Mineral Reserves are reported using the 2014 CIM Definition Standards and 2019 Best Practices Guidelines and have an effective date of January 14, 2025.
- Mineral Reserves are defined within mine plans and incorporate mining dilution and ore losses.
- Open Pit Mineral Reserves are based on metal prices of $23.75/oz Ag, $1,850/oz Au and $4.00/lb Cu, and are constrained within optimized pit shells and designs that use 45–48º overall wall slopes, and process recoveries of 86% Ag, 95% Au and 51% Cu.
- An Open Pit cut-off grade of 46.4 g/t AgEq is estimated to differentiate ore from waste and is based on cost assumptions of $26.22/t processing, $4.11/t site general and administrative, and 0.5% government mining tax on net revenue. Mining costs are estimated at $2.10/t of ore and waste rock.
- Underground Mineral Reserves are based on metal prices of $23.75/oz Ag, $1,850/oz Au and $4.00/lb Cu, and are constrained within a mine design, and use process plant recoveries of 86% Ag, 95% Au and 77% Cu.
- An Underground marginal cut-off grade of 150 g/t AgEq is estimated to differentiate ore from waste, and is based on cost assumptions of $34.93/t processing, $4.46/t site general and administrative, and mining costs of $41.93/t. An Underground economic cut-off grade of 210 g/t AgEq is estimated to account for capital development costs of $53.86/t in addition to those used to calculate the marginal cut-off grade.
- Totals may not sum due to rounding.
Table 8: Los Ricos South Mineral Resource Estimate – Pit Constrained and Out-of-Pit(1-9)
| Mining Method |
Category | Tonnes | Average Grade | Contained Metal | ||||||||
| Ag | Au | Cu | AuEq | AgEq | Ag | Au | Cu | AuEq | AgEq | |||
| (M) | (g/t) | (g/t) | ( %) | (g/t) | (g/t) | (koz) | (koz) | (Mlb) | (koz) | (koz) | ||
| Pit Constrained5 |
Measured | 2.9 | 150 | 1.13 | 0.03 | 2.96 | 250 | 14,065 | 106 | 1.7 | 278 | 23,446 |
| Indicated | 2.0 | 107 | 0.74 | 0.03 | 2.07 | 174 | 6,747 | 47 | 1.4 | 130 | 10,974 | |
| M&I | 4.9 | 133 | 0.97 | 0.03 | 2.60 | 219 | 20,812 | 153 | 3.1 | 408 | 34,420 | |
| Inferred | 0.7 | 108 | 0.66 | 0.03 | 2.00 | 168 | 2,552 | 16 | 0.5 | 47 | 3,979 | |
| Pit – Cerro C6 | Inferred | 0.6 | 43 | 0.90 | 0.01 | 1.43 | 121 | 787 | 17 | 0.1 | 26 | 2,243 |
| Indicated | 0.3 | 34 | 0.87 | 0.01 | 1.28 | 109 | 377 | 10 | 0.1 | 14 | 1,217 | |
| Out-of-Pit7,8 | Measured | 2.4 | 218 | 2.00 | 0.14 | 4.79 | 405 | 17,025 | 156 | 7.5 | 373 | 31,567 |
| Indicated | 3.1 | 187 | 2.25 | 0.26 | 4.80 | 407 | 18,525 | 223 | 17.4 | 476 | 40,331 | |
| M&I | 5.5 | 201 | 2.14 | 0.20 | 4.79 | 406 | 35,550 | 379 | 24.9 | 849 | 71,898 | |
| Inferred | 1.1 | 127 | 1.48 | 0.51 | 3.61 | 306 | 4,544 | 53 | 12.4 | 130 | 10,995 | |
| Total | Measured | 5.3 | 181 | 1.53 | 0.08 | 3.79 | 320 | 31,090 | 262 | 9.2 | 651 | 55,013 |
| Indicated | 5.6 | 144 | 1.59 | 0.15 | 3.50 | 296 | 26,059 | 287 | 18.9 | 632 | 53,549 | |
| M&I | 11.0 | 162 | 1.56 | 0.12 | 3.64 | 308 | 57,150 | 549 | 28.1 | 1,284 | 108,562 | |
| Inferred | 2.2 | 106 | 1.11 | 0.27 | 2.70 | 229 | 7,473 | 79 | 13.0 | 191 | 16,191 | |
- Mineral Resources, which are not Mineral Reserves, do not have demonstrated economic viability. The estimate of Mineral Resources may be materially affected by environmental, permitting, legal, title, taxation, socio-political, marketing, or other relevant issues.
- The Inferred Mineral Resource in this estimate has a lower level of confidence than that applied to an Indicated Mineral Resource and must not be converted to a Mineral Reserve. It is reasonably expected that the majority of the Inferred Mineral Resource could be upgraded to an Indicated Mineral Resource with continued exploration.
- The Mineral Resources were estimated in accordance with the Canadian Institute of Mining, Metallurgy and Petroleum (CIM), CIM Standards on Mineral Resources and Reserves, Definitions and Guidelines (2014) prepared by the CIM Standing Committee on Reserve Definitions and adopted by the CIM Council and CIM Best Practices Guidelines (2019) and have an effective date of January 14, 2025.
- Historically mined areas were depleted from the Mineral Resource model.
- The pit-constrained AgEq cut-off grade of 40 g/t was derived from $1,850/oz Au price, $23.75/oz Ag price, 86% Ag and 95% Au process recovery, $28/tonne process and G&A cost. The constraining pit optimization parameters were $2.10/t mineralized material and waste mining cost, and 45-degree pit slopes.
- The Cerro Colorado Mineral Resource was constrained to open pit mining methods only; Out-of-pit Mineral Resources are restricted to the Eagle and Abra mineralized veins, which exhibit historical continuity and reasonable potential for extraction by cut and fill and longhole underground mining methods.
- The out-of-pit AgEq cut-off grade of 130 g/t Ag was derived from $1,850/oz Au price, $23.75/oz Ag price, 86% Ag and 95% Au process plant recovery, $30/tonne process and G&A cost, and a $60/tonne mining cost. The out-of-pit Mineral Resource grade blocks were quantified above a 130 g/t AgEq cut-off, below the constraining pit shell and within the constraining mineralized wireframes. Out–of-Pit Mineral Resources are restricted to the Eagle and Abra Veins, which exhibit historical continuity and reasonable potential for extraction by cut and fill and longhole mining methods.
- AgEq and AuEq were calculated at an Ag/Au ratio of 86:1 for pit-constrained and out-of-pit Mineral Resources.
- Totals may not sum due to rounding.
Mineral Resource Estimate Methodology
A total of 554 drill holes totalling 90,095 metres were used in the MRE.
P&E collaborated with GoGold personnel to develop the mineralization models, estimates, and reporting criteria for the Mineral Resources at Los Ricos. Mineralization models were initially developed by GoGold and were reviewed and modified by P&E. A total of eight individual mineralized domains have been identified through drilling, surface and historical underground sampling. The modeled mineralization domains are constrained by individual wireframes based on a 0.30 g/t AuEq cut-off for low-grade domains or 3.0 g/t AuEq for high-grade domains.
Mineralization wireframes were used as hard boundaries for the purposes of grade estimation.
A three-dimensional sub-blocked model, with 3m x 3m x 3m parent and 1m x 1m x 1m sub-blocks, was used for the Mineral Resource Estimate. The block model consists of estimated Au, Ag and Cu grades, estimated bulk density, and classification criteria. Au and Ag equivalent block grades were subsequently calculated from the estimated Au, Ag and Cu grades.
Sample assays were composited to a 1 m standard length. Au and Ag grades were estimated using Inverse Distance Cubed weighting of between 1 and 12 composites, with a maximum of 2 composites per drill hole. Composites were capped prior to estimation by mineralization domain. Composite samples were selected within an anisotropic search ellipse oriented down the plunge of identified high grade trends.
Individual bulk density values were applied to mineralized domains separately and were statistically determined using 4,515 measurements taken from drill holes.
Classification criteria were determined from observed grade and geological continuity as well as variography. Measured Mineral Resources are informed by three or more drill holes within 30 m; Indicated Mineral Resources are informed by two or more drill holes within 60 m.
P&E is of the opinion that the Mineral Resource Estimate is suitable for public reporting and is a reasonable representation of the mineralization and metal content of the Los Ricos Deposits.
Table 9: Los Ricos South & North Mineral Resources(1-4)
| Deposit | Tonnes | Average Grade | Contained Metal | ||||||||||||
| Ag | Au | Cu | Pb | Zn | AuEq | AgEq | Ag | Au | Cu | Pb | Zn | AuEq | AgEq | ||
| (M) | (g/t) | (g/t) | ( %) | ( %) | ( %) | (g/t) | (g/t) | (koz) | (koz) | (Mlb) | (Mlb) | (Mlb) | (koz) | (koz) | |
| LRS Measured1 | 5.3 | 181 | 1.53 | 0.08 | – | – | 3.79 | 320 | 31,090 | 262 | 9 | – | – | 651 | 55,013 |
| Indicated: | |||||||||||||||
| LRN (Oxide)2 | 14.5 | 100 | 0.37 | – | – | – | 1.71 | 127 | 46,500 | 171 | – | – | – | 801 | 59,100 |
| LRS (Oxide)1 | 5.6 | 144 | 1.59 | 0.15 | – | – | 3.5 | 296 | 26,059 | 287 | 19 | – | – | 632 | 53,549 |
| LRN (Sulfide)2 | 7.8 | 28 | 0.06 | 0.11 | 0.88 | 1.33 | 1.55 | 114 | 7,011 | 15 | 19 | 151 | 229 | 389 | 28,708 |
| Total Indicated | 27.9 | 2.03 | 158 | 79,570 | 473 | 38 | 151 | 229 | 1,822 | 141,357 | |||||
| Measured & Indicated |
33.2 | 2.32 | 184 | 110,660 | 735 | 47 | 151 | 229 | 2,473 | 196,370 | |||||
| Inferred: | |||||||||||||||
| LRN (Oxide)2 | 15 | 91 | 0.28 | – | – | – | 1.52 | 112 | 44,131 | 136 | – | – | – | 734 | 54,191 |
| LRS (Oxide)1 | 2.2 | 106 | 1.11 | 0.27 | – | – | 2.7 | 229 | 7,473 | 79 | 13.0 | – | – | 191 | 16,191 |
| LRN (Sulfide)2 | 5.5 | 28 | 0.06 | 0.12 | 0.74 | 1.2 | 1.46 | 108 | 4,888 | 11 | 15 | 90 | 146 | 258 | 19,007 |
| Total Inferred | 22.7 | 1.62 | 122 | 56,492 | 226 | 28 | 90 | 146 | 1,183 | 89,389 | |||||
- See Table 8 notes for assumptions
- See GoGold press release #18-2023 dated June 30, 2023, or the technical report filed on that date on SEDAR+ for full details regarding the Los Ricos North Mineral Resource.
- Totals may not agree due to rounding.
Qualified Persons
The FS is prepared by consultants who are independent of GoGold, each of whom are Qualified Persons as defined by NI 43-101 Standards of Disclosure for Mineral. Each of the QPs have reviewed and confirmed that this news release fairly and accurately reflects, in the form and context in which it appears, the information contained in the respective sections of the FS for which they are responsible. The affiliation and areas of responsibility for each QP involved are as follows:
P&E QPs
Eugene Puritch, P.Eng., FEC, CET – Mineral resources
Andrew Bradfield, P. Eng. – Study leader and open pit mine design, scheduling and costs
Greg Robinson, P. Eng. – Underground mine design, scheduling and costs
Grant Feasby, P. Eng. – Environmental
Fred H. Brown, P. Eng. – Mineral resources
Ausenco QPs
Robert Raponi, P. Eng. – Metallurgy and mineral processing, recovery methods
Scott Elfen, PE – Dry stack tailings facility design
Jonathan Cooper, P. Eng. – Surface water management design
WSP QP
James Smith, P. Eng. – Open pit and underground geotechnical
D.E.N.M. Engineering QP
David Salari, P. Eng. – SART design & costing
Robert Harris, P.Eng. and David Duncan, P.Geo. are the non-independent GoGold QPs who have reviewed and verified the technical content of this news release.
VRIFY Slide Deck and 3D Presentation
VRIFY is a platform being used by companies to communicate with investors using 360° virtual tours of remote mining assets, 3D models and interactive presentations. VRIFY can be accessed by website and with the VRIFY iOS and Android apps.
The VRIFY 3D Slide Deck for GoGold can be viewed at: https://vrify.com/companies/gogold-resources-inc and on the Company’s website at: www.gogoldresources.com.
Los Ricos District Exploration Projects
The Company’s two exploration projects at its Los Ricos Property are in Jalisco state, Mexico. The Los Ricos South Project began in March 2019, with the most recent Mineral Resource Estimate disclosing a Measured & Indicated Mineral Resource of 98.6 million ounces AgEq grading 276 g/t AgEq contained in 11.1 million tonnes, and an Inferred Mineral Resource of 13.6 million ounces AgEq grading 185 g/t AgEq contained in 2.3 million tonnes. A FS on the project was announced in this news release indicating an after-tax NPV5% of US$355M, based on Proven and Probable Mineral Reserves totalling 10.2 million tonnes grading 276 g/t AgEq containing 91 million ounces AgEq, including 7.5 million underground tonnes grading 326 g/t AgEq.
The Los Ricos North Project was launched in March 2020 and an initial Mineral Resource Estimate was announced on December 7, 2021, which disclosed an Indicated Mineral Resource Estimate of 87.8 million ounces AgEq grading 122 g/t AgEq contained in 22.3 million tonnes, and an Inferred Mineral Resource Estimate of 73.2 million ounces AgEq grading 111 g/t AgEq contained in 20.5 million tonnes. An initial PEA on the Project was announced on May 17, 2023, indicating an NPV5% of US$413M.
About GoGold Resources
GoGold Resources (TSX: GGD) is a Canadian-based silver and gold producer focused on operating, developing, exploring and acquiring high quality projects in Mexico. The Company operates the Parral Tailings Project in the state of Chihuahua and has the Los Ricos South and Los Ricos North exploration Projects in the state of Jalisco. Headquartered in Halifax, NS, GoGold is building a portfolio of low cost, high margin projects. For more information visit gogoldresources.com.
MORE or "UNCATEGORIZED"
Delta Reports New Gold Intercept at Nova Target in Wedge Area, 4 Kilometres West of Eureka; Follow-Up Drill Program Underway
Delta Reports New Gold Intercept at Nova Target in Wedge Area, 4 ... READ MORE
Silver One Announces Closing Of Final Tranche Of $32 Million Financing
Silver One Resources Inc. (TSX-V: SVE) (OTCQX: SLVRF) (FSE: BRK1)... READ MORE
SAGA Metals Achieves 100% Drilling Success in 2025—Reports Final Assays from Trapper South at Radar Critical Minerals Project in Labrador
Exceptional grades of Titanium, Vanadium and Iron in all 15 drill... READ MORE
Near Surface Intersection Yields 6.58 g/t gold over 10.35 metres
Intersection is within 33 metres from surface and contained in a ... READ MORE
Alamos Gold Provides Three-Year Operating Guidance Outlining 46% Production Growth by 2028 at Significantly Lower Costs
Further production growth to one million ounces annually expected... READ MORE


