West Red Lake Gold Intersects 113.74 g/t Au Over 0.5m, 104.98 g/t Au Over 0.4m and 74.36 g/t Au Over 0.5m at Rowan Mine
West Red Lake Gold Mines Ltd. (TSX-V:WRLG) (OTCQB: WRLGF) is pleased to report additional drill results from its Phase 1 exploration program on its 100% owned Rowan Property located in the prolific Red Lake Gold District of Northwestern, Ontario, Canada (initial drill results reported on May 23, 2023).
HIGHLIGHTS:
- Hole RLG-23-146 Intersected 2.8m @ 20.9 g/t Au, from 349.7m to 352.5m, Including 0.5m @ 113.74 g/t Au, from 349.7m to 350.2m
- Hole RLG-23-133 Intersected 0.4m @ 104.98 g/t Au, from 74.85m to 75.25m
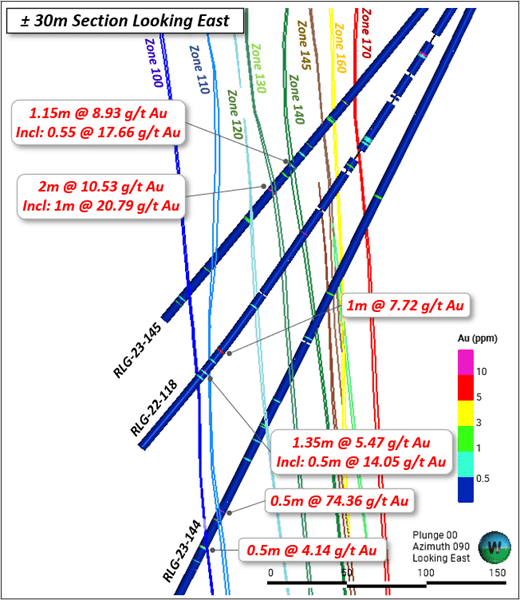
- Hole RLG-23-144 Intersected 0.5m @ 74.36 g/t Au, from 452.5m to 453m
- Hole RLG-23-146 Intersected 1.35m @ 16.34 g/t Au, from 241m to 242.35m, Including, 0.85m @ 25.8 g/t Au from 241m to 241.85m
- Hole RLG-23-145 Intersected 2m @ 10.53 g/t Au, from 265m to 267m, Including, 1m @ 20.79 g/t Au from 266m to 267m
The high-grade mineralized vein zones encountered at the Rowan Mine target area (the “Rowan Mine Target”) are in-line with expectations on gold grade, confirm the geologic model, and help to bolster the existing high-grade (9.2 g/t Au) 827,462 ounce Inferred Mineral Resource at the Rowan Mine. Sections for the Rowan Mine drilling outlined in this release are provided in Figures 2 through 7.
Shane Williams, President & CEO, stated, “We are delighted with the continued success our geologic team is having at the Rowan Mine Target. Drilling continues to intercept high-grade gold at or near projected depths, confirming our model of the Rowan vein system. This enriches our understanding of the grade continuity and gold distribution within individual vein zones. Moreover, the discovery of visible gold and mineralization in veins subsidiary to the main structures indicates much more gold in the overall system than previously believed.
Several drill intercepts received to date have returned assay results at higher grades than those in the existing Inferred resource block model. We look forward to updating the Rowan mineral resource, which currently hosts Inferred resources of 827,462 ounces at 9.2 g/t gold.
With the acquisition of the Madsen Gold Project, the Company has secured the necessary infrastructure, potentially accelerating the production timeline for Rowan, which is situated within trucking distance from the Madsen Mill.”
A total of 23 diamond drill holes totaling 6,063m have been completed so far in 2023 at the Rowan Mine target area. Fire and metallic screen assays have been returned for 19 out of 23 holes completed, with 4 holes pending assays and QAQC at the time of this writing.
TABLE 1. Significant intercepts (>4gpt Au) from Phase 1 drilling at Rowan Mine Target.
| Hole ID | Target | From (m) | To (m) | Thick (m)* | Au (g/t) |
| RLG-22-118 | Rowan Mine | 371 | 372 | 1 | 7.72 |
| AND | Rowan Mine | 387.5 | 388.85 | 1.35 | 5.47 |
| Incl. | Rowan Mine | 387.5 | 388 | 0.5 | 14.05 |
| RLG-23-133 | Rowan Mine | 74.85 | 75.25 | 0.4 | 104.98 |
| RLG-23-136 | Rowan Mine | 59 | 60.35 | 1.35 | 8.08 |
| Incl. | Rowan Mine | 59.85 | 60.35 | 0.5 | 13.95 |
| AND | Rowan Mine | 140 | 141.5 | 1.5 | 5.77 |
| Incl. | Rowan Mine | 141 | 141.5 | 0.5 | 13.18 |
| RLG-23-137 | Rowan Mine | 49.83 | 50.95 | 1.12 | 4.43 |
| AND | Rowan Mine | 79 | 81 | 2 | 4.88 |
| Incl. | Rowan Mine | 79.92 | 81 | 1.08 | 7.6 |
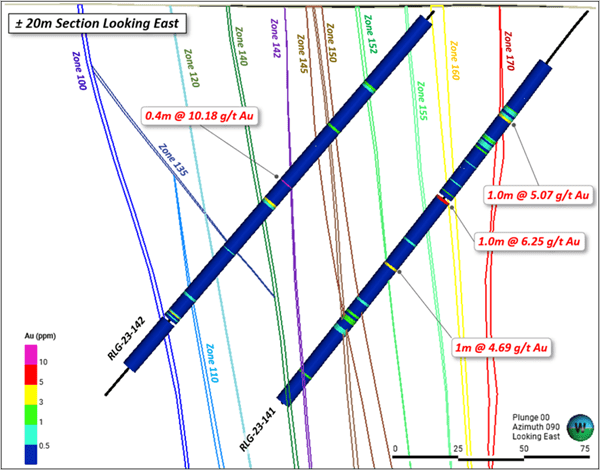
| RLG-23-141 | Rowan Mine | 51 | 52 | 1 | 5.07 |
| AND | Rowan Mine | 90 | 91 | 1 | 6.25 |
| AND | Rowan Mine | 122 | 123 | 1 | 4.69 |
| RLG-23-142 | Rowan Mine | 86 | 86.4 | 0.4 | 10.18 |
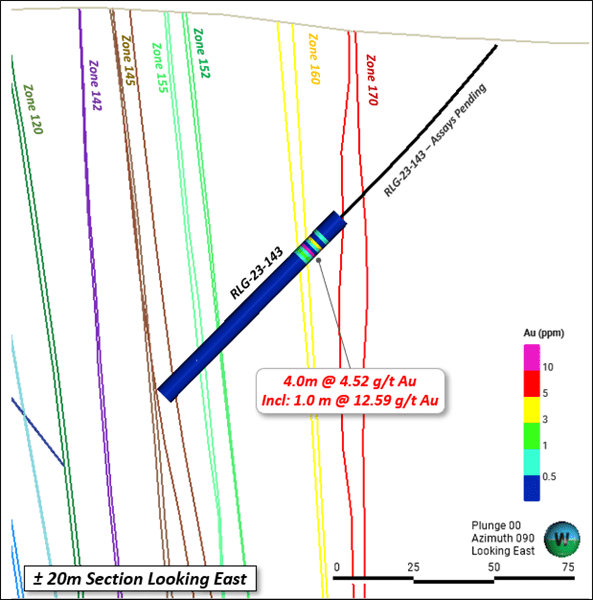
| RLG-23-143 | Rowan Mine | 83 | 87 | 4 | 4.52 |
| Incl. | Rowan Mine | 86 | 87 | 1 | 12.59 |
| RLG-23-144 | Rowan Mine | 452.5 | 453 | 0.5 | 74.36 |
| AND | Rowan Mine | 477.65 | 478.15 | 0.5 | 4.14 |
| RLG-23-145 | Rowan Mine | 245.7 | 246.85 | 1.15 | 8.93 |
| Incl. | Rowan Mine | 246.3 | 246.85 | 0.55 | 17.66 |
| AND | Rowan Mine | 265 | 267 | 2 | 10.53 |
| Incl. | Rowan Mine | 266 | 267 | 1 | 20.79 |
| RLG-23-146 | Rowan Mine | 200 | 200.5 | 0.5 | 4.06 |
| AND | Rowan Mine | 241 | 242.35 | 1.35 | 16.34 |
| Incl. | Rowan Mine | 241 | 241.85 | 0.85 | 25.8 |
| AND | Rowan Mine | 248 | 249 | 1 | 4.06 |
| AND | Rowan Mine | 250 | 250.5 | 0.5 | 8.24 |
| AND | Rowan Mine | 349.7 | 352.5 | 2.8 | 20.9 |
| Incl. | Rowan Mine | 349.7 | 350.2 | 0.5 | 113.74 |
| RLG-23-147 | Rowan Mine | 258.85 | 261 | 2.15 | 6.07 |
| Incl. | Rowan Mine | 258.85 | 259.35 | 0.5 | 16.8 |
| AND | Rowan Mine | 363.35 | 364.35 | 1 | 18.24 |
| Incl. | Rowan Mine | 363.35 | 363.85 | 0.5 | 36.37 |
*The “From-To” intervals in Table 1 are denoting overall downhole length of the intercept. True thickness has not been calculated for these intercepts but is expected to be ≥ 70% of downhole thickness based on intercept angles observed in the drill core. Composite intervals do not cross sample boundaries < 0.1 g/t Au.
An additional 1,000m of diamond drilling planned for the Phase 1 program is currently ongoing and expected to be completed on target in early July, 2023. The focus of this drilling is on infill and expansion within high-grade mineralized zones at the Rowan Mine resource area. Upon completion of Phase 1, the Company will lead directly into its Phase 2 program, which will include an additional 10,000m of drilling to further build on Phase 1 exploration work and to continue de-risking the high-grade Rowan Mine resource.
It is the Company’s belief that potential synergies could exist between high-grade resources at the Rowan Mine target area and Madsen. Early indications suggest that the gold mineralization at Rowan could be amenable to gravity separation. The Company has initiated a metallurgical study at Rowan to begin evaluating this potential opportunity, as well as a geotechnical study to better characterize the rock mass properties within the mineralized vein zones at Rowan.
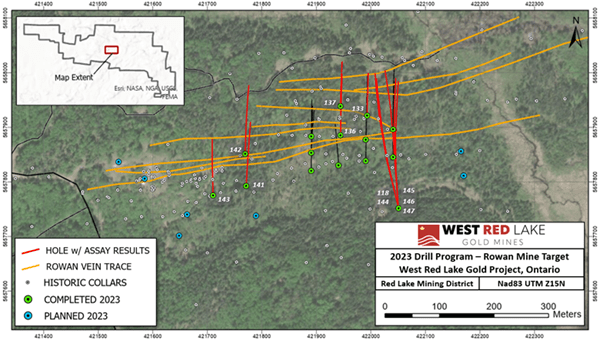
FIGURE 1. Rowan drilling completed to date. Traces for holes with assays highlighted in this news release shown in red. Traces for holes with assays previously reported shown in black.
TABLE 2: Drill collar summary for holes reported in this News Release.
| Hole ID | Target | Easting | Northing | Elev (m) | Length (m) | Azimuth | Dip |
| RLG-22-118 | Rowan Mine | 422051 | 5657750 | 384 | 327 | 357 | -60 |
| RLG-23-133 | Rowan Mine | 421994 | 5657920 | 367 | 120 | 0 | -50 |
| RLG-23-136 | Rowan Mine | 421945 | 5657885 | 367 | 171 | 0 | -50 |
| RLG-23-137 | Rowan Mine | 421945 | 5657938 | 367 | 120 | 0 | -50 |
| RLG-23-141 | Rowan Mine | 421772 | 5657793 | 368 | 189 | 0 | -50 |
| RLG-23-142 | Rowan Mine | 421770 | 5657851 | 368 | 192 | 0 | -50 |
| RLG-23-143 | Rowan Mine | 421711 | 5657775 | 368 | 150 | 0 | -50 |
| RLG-23-144 | Rowan Mine | 422051 | 5657753 | 380 | 520 | 355 | -65 |
| RLG-23-145 | Rowan Mine | 422051 | 5657752 | 380 | 372 | 355 | -52 |
| RLG-23-146 | Rowan Mine | 422051 | 5657752 | 380 | 372 | 345 | -50 |
| RLG-23-147 | Rowan Mine | 422051 | 5657752 | 380 | 411 | 345 | -55 |
DISCUSSION
The Rowan Mine Target consists of more than seven sub-parallel, near-vertical, east-west trending veins that are currently defined over a strike length of approximately 1.1 kilometre (“km”) – mineralization remains open along strike and at depth. The orientation of the veins at the Rowan Mine tend to follow the direction of D2 deformation, which is oriented in an east-west direction over this part of the property. Individual mineralized vein zones usually average 1.0 to 1.5m in thickness, with an overall thickness of the Rowan vein corridor at around 115m. Gold mineralization is typically localized within quartz-carbonate veins hosted within and along the ‘footwall’ margin of a porphyritic felsic intrusive, with increased grades often associated with the presence of visible gold and base metal sulphides (e.g. galena, sphalerite). High-grade dilation zones or ‘ore chutes’ along the Rowan vein trend have been recognized as important controls for localizing thicker and higher-grade zones of gold mineralization. The position and geometry of these dilation zones is well understood at Rowan.
The Phase 1 drilling completed at the Rowan Mine Target in 2023 has been focused on validating historical data across the Inferred Resource, and also infilling apparent gaps in the analytical data set which was a product of very selective sampling techniques implemented during previous drilling campaigns. Assay results received from the 2023 Phase 1 drilling program continue to confirm our thesis that quartz veining and gold mineralization continue at depth and along strike, with grades consistent with, or higher than those outlined in the current Inferred Mineral Resource which remains open in all directions. For example, the 100 Vein Zone – which is the furthest north vein currently modeled within the overall Rowan vein corridor – was previously interpreted to be a lower grade portion of the block model. Recent drilling has confirmed that higher grades are present within the 100 Vein Zone below 150m elevation, suggesting that gold grades are increasing at depth within this zone which is a trend that has been observed elsewhere in the Red Lake district. Drilling at the Rowan Mine Target area will continue with an emphasis on infill and expansion of the existing high-grade mineral resource.
FIGURE 2. Rowan Mine drill section for Hole RLG-23-133.
FIGURE 3. Rowan Mine drill section for Holes RLG-23-136 and RLG-23-137.
FIGURE 4. Rowan Mine drill section for Holes RLG-23-141 and RLG-23-142.
FIGURE 5. Rowan Mine drill section for Holes RLG-23-143.
FIGURE 6. Rowan Mine drill section for Holes RLG-22-118, RLG-23-144 and RLG-23-145. RLG-22-118 was re-entered in 2023 and extended to intercept the deeper 100 and 110 vein zones.
FIGURE 7. Rowan Mine drill section for Holes RLG-22-146 and RLG-23-147. Note the high-grade intercepts encountered at depth within the 100 Vein Zone.
QUALITY ASSURANCE/QUALITY CONTROL
Drilling completed at the Rowan Property consists of oriented NQ-sized diamond drill core. All drill holes are systematically logged, photographed, and sampled by a trained geologist at WRLG’s Mt. Jamie core processing facility. Minimum allowable sample length is 0.5m. Maximum allowable sample length is 1.5m. Standard reference materials and blanks are inserted at a targeted 5% insertion rate. The drill core is then cut lengthwise utilizing a diamond blade core saw along a line pre-selected by the geologist. To reduce sampling bias, the same side of drill core is sampled consistently utilizing the orientation line as reference. For those samples containing visible gold a trained geologist supervises the cutting/bagging of those samples, and ensures the core saw blade is ‘cleaned’ with a dressing stone following the VG sample interval. Bagged samples are then sealed with zip ties and transported by WRLG personnel directly to SGS Natural Resource’s Facility in Red Lake, Ontario for assay.
Samples are then prepped by SGS, which consists of drying at 105°C and crushing to 75% passing 2mm. A riffle splitter is then utilized to produce a 500g course reject for archive. The remainder of the sample is then pulverized to 85% passing 75 microns from which 50g is analyzed by fire assay and an atomic absorption spectroscopy (AAS) finish. Samples returning gold values > 5 g/t Au are reanalyzed by fire assay with a gravimetric finish on a 50g sample. Samples with visible gold are also analyzed via metallic screen analysis (SGS code: GO_FAS50M). For multi-element analysis, samples are sent to SGS’s facility in Burnaby, British Columbia and analyzed via four-acid digest with an atomic emission spectroscopy (ICP-AES) finish for 33-element analysis on 0.25g sample pulps (SGS code: GE_ICP40Q12). SGS Natural Resources analytical laboratories operates under a Quality Management System that complies with ISO/IEC 17025.
West Red Lake Gold’s Rowan Property presently hosts a National Instrument 43-101 Inferred Mineral Resource of 2,790,700 t at an average grade of 9.2 g/t Au containing 827,462 ounces of gold with a cut-off grade of 3.8 g/t Au (NI 43-101 Technical Report authored by John Kita, P.Eng., dated December 13, 2022 and filed December 30, 2022 on sedar.com). The Inferred Mineral Resource is located in the area of the historic underground Rowan Mine site and situated within a 1.8 km strike length portion of the regional scale Pipestone Bay St Paul Deformation Zone.
The technical information presented in this news release has been reviewed and approved by Will Robinson, P.Geo., Vice President of Exploration for West Red Lake Gold and the Qualified Person for exploration at the West Red Lake Project, as defined by NI 43-101 “Standards of Disclosure for Mineral Projects”.
ABOUT WEST RED LAKE GOLD MINES
West Red Lake Gold Mines Ltd. is a mineral exploration company that is publicly traded and focused on advancing and developing its flagship Madsen Gold Mine and the associated 47 Km2 highly prospective land package in the Red Lake district of Ontario. The highly productive Red Lake Gold District of Northwest Ontario, Canada has yielded over 30 million ounces of gold from high-grade zones and hosts some of the world’s richest gold deposits. WRLG also holds the wholly owned Rowan Property in Red Lake, with an expansive property position covering 31 Km2 including three past producing gold mines – Rowan, Mount Jamie, and Red Summit.
MORE or "UNCATEGORIZED"
Delta Resources Options Delta-2 Project in Québec to Troilus Mining Corp. – $8.25M and 1% NSR to be paid over 3 years if option fully exercised
Delta Resources Limited (TSX-V:DLTA) (OTC Pink: DTARF) (FRANKFURT:6GO1) is pleased t... READ MORE
Deep Semi Massive Sulphide Zinc, Silver and Gold Intersection at Berrigan Property
Chibougamau Independent Mines Inc. (TSX-V: CBG) (Frankfurt: CLL1) (OTC: CMAUF), herein called Chibou... READ MORE
OR Royalties Acquires Additional 1.0% NSR Royalty on the Namdini Gold Mine in Ghana
OR Royalties Inc. (TSX: OR) (NYSE: OR) is pleased to announce that it has acquired an additional 1.0... READ MORE
Silver One Announces Closing of First Tranche for $31 Million
Silver One Resources Inc. (TSX-V: SVE) (OTCQX: SLVRF) (FSE: BRK1) is pleased to announce that... READ MORE
Gold X2 Announces Positive Reconciliation in Main Zone Grade Control Drilling with Intercepts Including 49.0m of 2.13 g/t Au
Gold X2 Mining Inc. (TSX-V: AUXX) (OTCQB: GSHRF) (FWB: DF8), is pleased to announce the fourth and f... READ MORE


