








Magna Mining Inc. (TSX: NICU) (OTCQX: MGMNF) (FSE: 8YD) is pleased to announce the results of a Pre-Feasibility Study prepared in accordance with National Instrument 43-101 – Standards of Disclosure for Mineral Projects for the 100% owned Crean Hill Project, located in the South Range of the Sudbury Basin, northeastern Ontario. All amounts are expressed in Canadian dollars unless otherwise indicated.
Crean Hill PFS Highlights:
Crean Hill construction to commence in 2027: Based on the results of the PFS (summarized in Table 1), the Company’s Board of Directors has approved construction of the Crean Hill project, which will commence in 2027. In the interim, the Company will continue with detailed engineering work, surface site preparations including installation of grid power and recruitment of additional personnel.
Crean Hill exploration drilling now underway: In addition, an exploration diamond drill rig has been mobilized to the Crean Hill Project and has started drill testing new targets for additional footwall copper and precious metals-rich mineralization.
1 Base case price assumptions: US$5.10/lb Cu, US$8.00/lb Ni, US$20.00/lb Co, US$3,600/oz Au, US$1,500/oz Pt, US$1,200/oz Pd, US$45.00/oz Ag; CAD/USD $1.385. Illustrative spot price case assumptions based on September 2026 average prices: US$6.55/lb Cu, US$7.50/lb Ni, US$24.90/lb Co, US$4,320/oz Au, US$1,785/oz Pt, US$1,310/oz Pd, US$64.50/oz Ag; CAD/USD $1.370.
2 Payable CuEq production considers base case price assumptions and modeled recovery and payabilities for each metal.
3 Assumes $17.2 million in refundable tax credits via the Clean Technology Manufacturing Investment Tax Credit (CTM-ITC).
4 On September 15, 2026, the Canadian federal government announced the Productivity Mega Deduction (“PMD”), allowing businesses to immediately deduct the cost of a broad range of capital assets, rather than claiming those deductions over time. The PMD is subject to legislative approval.
Jason Jessup, CEO of Magna Mining, stated, “We are pleased to announce the results of the Crean Hill PFS, which demonstrates robust economics and a clear path toward construction. The base case delivers an after-tax IRR of 43.4% and a 1.5-year payback period. Crean Hill also benefits from a balanced mix of copper, nickel and precious metals production, providing meaningful exposure to seven payable metals without an overreliance on any single commodity.
The PFS outlines a 12-year commercial mine life and C$72.4 million of net initial funding after refundable tax credits and pre-commercial production operating cash flow. The development plan builds on the core approach established in the 2024 Crean Hill PEA—advancing a new ramp from surface before re-establishing shaft hoisting—and leverages the project’s brownfield setting and existing infrastructure. On the strength of these results, our Board has approved moving forward with construction in 2027. In the interim, our team will continue detailed engineering and design, advance procurement of long-lead items, site preparation and recruitment of the additional people needed to execute the plan. We are also excited to have initiated exploration drilling at Crean Hill for the first time since 2024. I would like to thank everyone whose work and commitment have advanced the project to this important milestone.”
| Table 1: Key Crean Hill PFS Project Metrics | ||
| Production Profile | Unit | |
| Commercial Mine Life | 12.0 | years |
| Mining rate1 | 2,397 | tons per day |
| Total mined ore (Probable Reserve) | 11,358,861 | tons |
| CuEq head grade1,5 | 2.99% | |
| Avg. annual copper production1 | 9.5 | million payable lbs |
| Avg. annual nickel production1 | 7.5 | million payable lbs |
| Avg. annual precious metals production1 | 42.0 | koz Pt+Pd+Au payable |
| Avg. annual CuEq production1,5 | 35.5 | million payable lbs |
| Operating Costs | Unit | |
| Production costs LOM | $152.62 | C$ per ton processed |
| Total cash costs LOM | US$3.10 | US$ per CuEq payable lb |
| All-in sustaining costs LOM | US$3.55 | US$ per CuEq payable lb |
| Capital Costs | ||
| Initial capital2 | $127.0 | C$ million |
| Refundable tax credits | -$17.2 | C$ million |
| Pre-commercial production operating cash flow | -$37.4 | C$ million |
| Net initial funding | $72.4 | C$ million |
| LOM sustaining capital | $261.7 | C$ million |
| Project Economics | Base Case3 | Spot Price Case4 |
| Avg. annual operating cash flow1 (C$ million) | C$87.3 M | C$118.3 M |
| Pre-tax NPV7% (C$ million) | C$329.7 M | C$554.3 M |
| After-tax NPV7% (C$ million) | C$251.0 M | C$406.1 M |
| After-tax IRR | 43.4% | 65.4% |
| After-tax cash flow LOM (C$ million) | C$507.8 M | C$779.2 M |
| After-tax payback period | 1.5 years | 0.8 years |
| After-tax NPV7% with PMD6 (C$ million) | C$256.7 M | C$412.4 M |
| After-tax IRR with PMD6 | 45.5% | 68.0% |
1Production averages cover commercial production from Years 4-15. CuEq head grade is on a contained basis covering Life of Mine, CuEq determined using base case metal price assumptions. Tons are short tons (2,000 lb).
2Year 1-3 pre-commercial production capital, after equipment financing timing effect; before operating cash flow and refundable tax credits. Payback is measured from end of Year 3.
3US$5.10/lb Cu, US$8.00/lb Ni, US$20.00/lb Co, US$3,600/oz Au, US$1,500/oz Pt, US$1,200/oz Pd, US$45.00/oz Ag; CAD/USD $1.385.
4Illustrative spot-price case based on September 2026 average prices: US$6.55/lb Cu, US$7.50/lb Ni, US$24.90/lb Co, US$4,320/oz Au, US$1,785/oz Pt, US$1,310/oz Pd, US$64.50/oz Ag; CAD/USD $1.370.
5See Tables included with Figures 2 and 3 for grades and contribution of specific metals.
6On September 15, 2026, the Canadian federal government announced the proposed Productivity Mega Deduction (“PMD”), which would permit the immediate deduction of certain eligible capital expenditures for income tax purposes. As the PMD has not yet been enacted into law, the benefit has been excluded from the base-case economic analysis and is presented separately as a sensitivity.
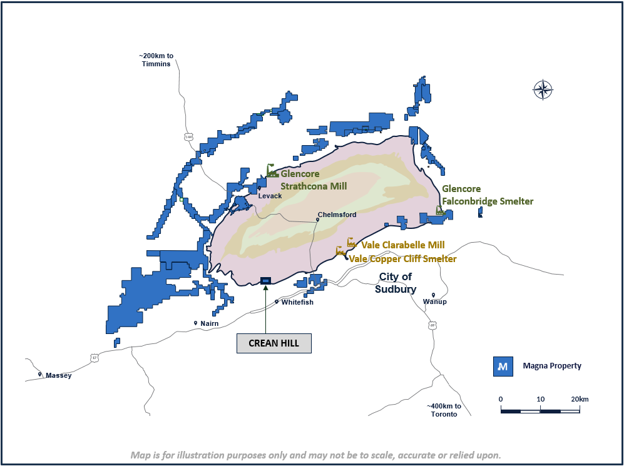
Figure 1: Location of Crean Hill and Key Sudbury Infrastructure
PFS Overview
The Crean Hill project, located in the South Range of the Sudbury Basin (Figure 1), is a brownfield redevelopment of the past-producing nickel-copper-precious metals (platinum, palladium, gold, silver) Crean Hill Mine. Since 1906, the Crean Hill mine site underwent multiple phases of open-pit and underground mining with the most recent operations having ceased in 2002. During this period, approximately 20.4 million tonnes of ore were produced at an average grade of 1.31% nickel, 1.09% copper, and 1.56 g/t total precious metals (platinum + palladium + gold). The underground workings have subsequently flooded, and all surface infrastructure dismantled. In November 2022, the Company acquired Lonmin Canada Inc., including the past-producing Crean Hill Mine. The Company holds the mining rights from the top of the existing concrete capped Shaft #2 (former historic Crean Hill Mine production shaft) to a depth of 4,500 feet (1,372 metres). Vale Canada Limited (Vale) continues to hold all Mining Rights below 4,500 feet. Topics covered in the PFS include the mining design basis, geotechnical design basis, hydrogeology and dewatering, mine access and design, mining method and stope design, development, production schedule, metallurgy, mobile fleet, workforce, ventilation, backfill, material handling and grade control. The PFS was prepared by SGS Geological Services (SGS) with the assistance of Magna’s Projects team, as well as insights from current operations at the Company’s McCreedy West Mine in Sudbury. The PFS incorporates geological information collected by the Company including 199 diamond drill holes for a total of 44,895 metres of drilling between November 2022 and December 2024, the results from the 20,000 tonne bulk sample program executed in the second half of 2024, as well as historic information from the previous underground mining operations at Crean Hill.
Mine Plan and Production Schedule
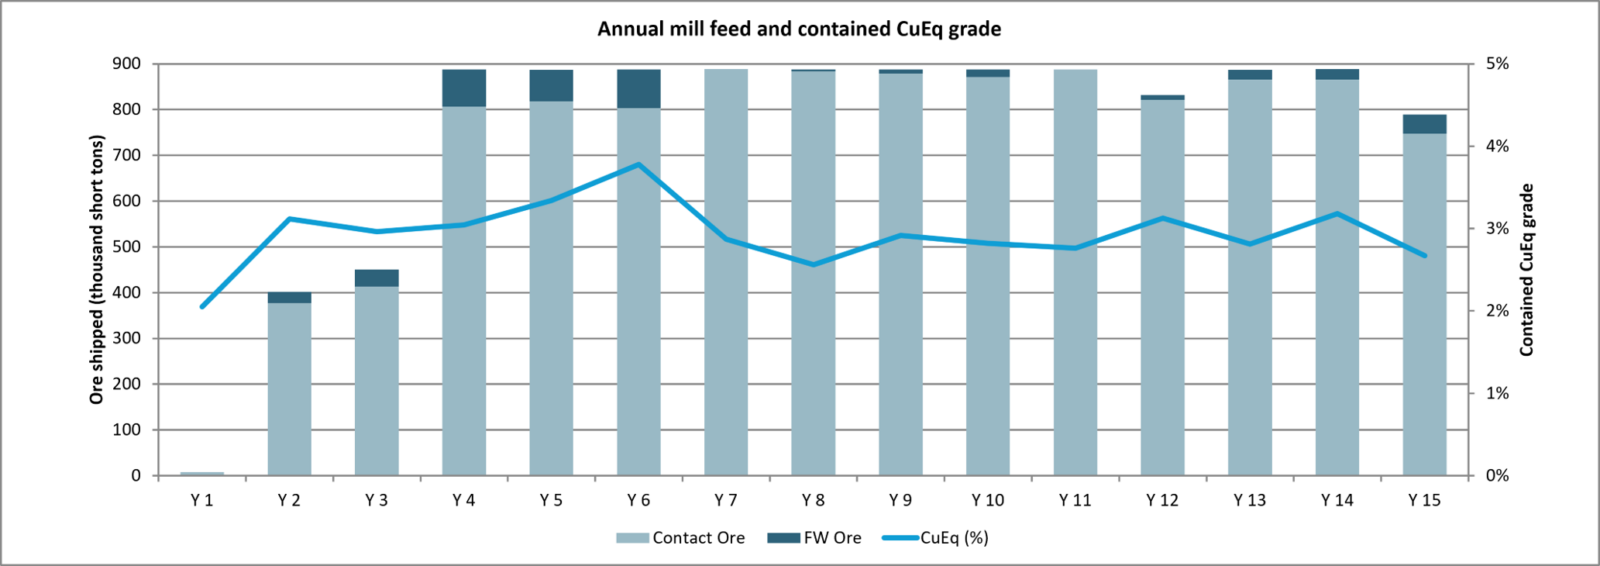
The Crean Hill PFS mine plan (summarized in Table 1) envisions an underground mining operation, with the probable reserves being hauled and sold to an existing third-party mill in Sudbury. Initial mining is contemplated by ramp access via a new surface portal with the eventual rehabilitation and re-establishment of the historic Shaft #2 for ore hoisting as mining progresses deeper. The PFS assumes go-forward capital spending begins on January 1, 2027 and ramps up over the first three years with initial ore generated towards the end of Year 1 and commercial production anticipated at the end of Year 3 (Figure 2). At the target commercial production rate of approximately 2,400 short tons per day, the mine plan includes 11.4 million short tons over a 12.0 year mine life.
The mineralized zones incorporated in the PFS mine plan include both contact ore (including the Main, Intermediate, 99 and 9400 Zones) as well as footwall ore (the 109 FW Zone). The 11.4 million short tons of probable reserves are derived from the current Crean Hill Mineral Resource Estimate.
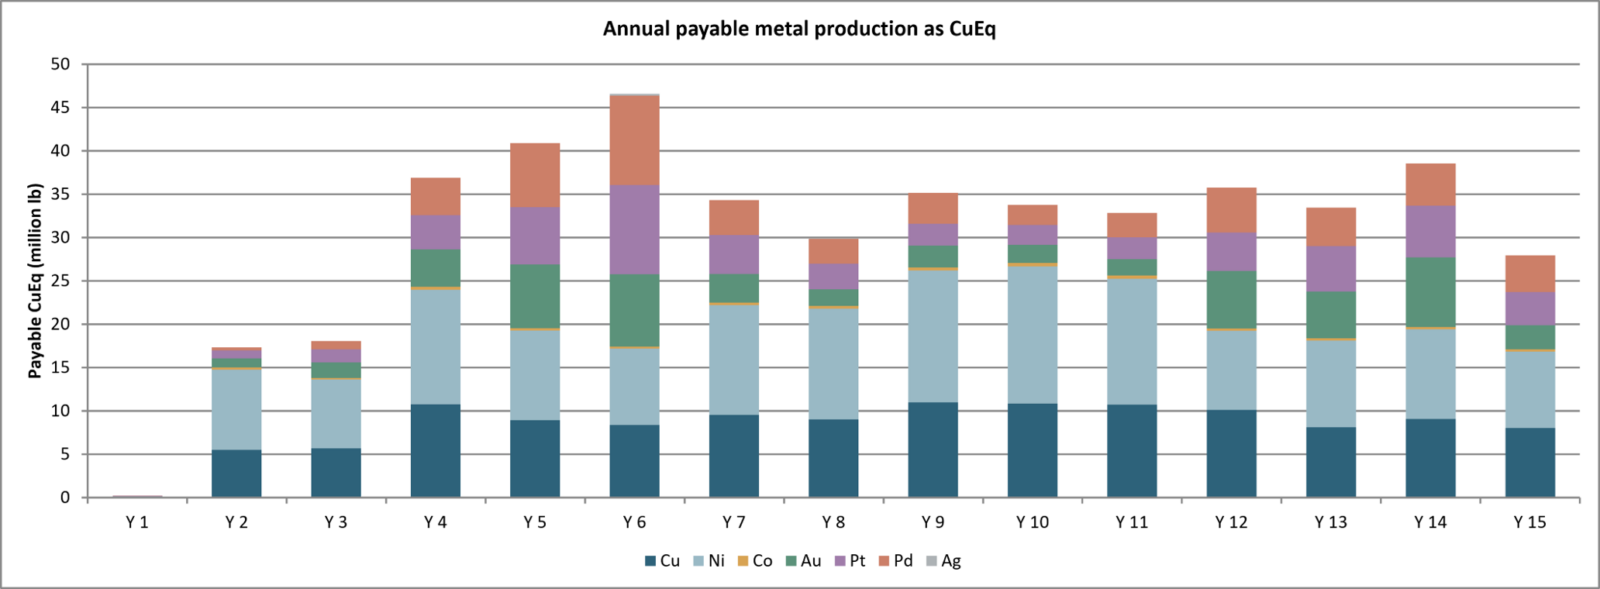
Figure 2 shows annual mill feed by ore type and contained CuEq head grade. During commercial production (Years 4-15), ore shipped and processed averages 875,000 tons per year. The contained CuEq head grade uses base case metal prices, without recovery, payability, or cost deductions and averages 2.99% CuEq over the twelve-year commercial mine life. Figure 3 shows payable metal production expressed as CuEq, using the modeled recoveries and payabilities. Precious metal head grades in Figure 2 are in grams per tonne. Annual payable metal production during the twelve-year commercial mine life averages 35.5 million lbs CuEq, comprised of 9.5 million lbs copper, 7.5 million lbs nickel, 6,400 oz gold, 15,600 oz platinum, and 19,900 oz palladium.
Figure 2: Crean Hill PFS Production Schedule & Contained Copper Equivalent Grade
| Year | Y 1 | Y 2 | Y 3 | Y 4 | Y 5 | Y 6 | Y 7 | Y 8 | Y 9 | Y 10 | Y 11 | Y 12 | Y 13 | Y 14 | Y 15 | |
| Ore shipped (short tons) |
8,139 | 401,572 | 450,372 | 887,305 | 887,056 | 887,533 | 888,744 | 887,497 | 887,557 | 888,088 | 887,387 | 832,259 | 887,188 | 888,906 | 789,259 | |
| Contained Grades |
CuEq (%) | 2.05 | 3.12 | 2.96 | 3.04 | 3.34 | 3.78 | 2.87 | 2.56 | 2.92 | 2.82 | 2.76 | 3.13 | 2.81 | 3.18 | 2.67 |
| Cu (%) |
0.49 | 0.77 | 0.71 | 0.68 | 0.56 | 0.53 | 0.60 | 0.57 | 0.69 | 0.69 | 0.68 | 0.68 | 0.51 | 0.57 | 0.57 | |
| Ni (%) |
0.59 | 1.01 | 0.80 | 0.70 | 0.59 | 0.52 | 0.68 | 0.68 | 0.79 | 0.81 | 0.76 | 0.56 | 0.57 | 0.58 | 0.56 | |
| Co (%) |
0.02 | 0.03 | 0.03 | 0.02 | 0.02 | 0.02 | 0.02 | 0.02 | 0.03 | 0.03 | 0.03 | 0.02 | 0.02 | 0.02 | 0.02 | |
| Au (gpt) |
0.21 | 0.25 | 0.33 | 0.39 | 0.61 | 0.68 | 0.32 | 0.22 | 0.27 | 0.24 | 0.22 | 0.59 | 0.47 | 0.66 | 0.31 | |
| Pt (gpt) |
0.43 | 0.57 | 0.74 | 0.87 | 1.31 | 1.93 | 0.96 | 0.73 | 0.66 | 0.62 | 0.65 | 1.00 | 1.09 | 1.20 | 0.92 | |
| Pd (gpt) |
0.39 | 0.35 | 0.61 | 1.09 | 1.69 | 2.30 | 1.04 | 0.80 | 0.94 | 0.68 | 0.78 | 1.30 | 1.09 | 1.17 | 1.16 | |
| Ag (gpt) |
0.96 | 0.87 | 1.31 | 0.74 | 1.07 | 2.84 | 0.83 | 0.57 | 0.99 | 1.05 | 1.23 | 0.58 | 0.55 | 1.46 | 0.97 | |
Figure 3: Crean Hill PFS Copper Equivalent Payable Metal Production
| Year | Y 1 | Y 2 | Y 3 | Y 4 | Y 5 | Y 6 | Y 7 | Y 8 | Y 9 | Y 10 | Y 11 | Y 12 | Y 13 | Y 14 | Y 15 | |
| Payable Metal |
CuEq (million lb) |
0.21 | 17.33 | 18.09 | 36.92 | 40.90 | 46.60 | 34.35 | 29.88 | 35.16 | 33.77 | 32.84 | 35.76 | 33.46 | 38.53 | 27.96 |
| Cu (million lb) |
0.07 | 5.51 | 5.69 | 10.78 | 8.93 | 8.37 | 9.57 | 9.05 | 10.97 | 10.85 | 10.73 | 10.10 | 8.11 | 9.07 | 8.06 | |
| Ni (million lb) |
0.06 | 5.92 | 5.06 | 8.42 | 6.62 | 5.63 | 8.04 | 8.13 | 9.70 | 10.10 | 9.26 | 5.84 | 6.38 | 6.60 | 5.61 | |
| Co (million lb) |
0.001 | 0.060 | 0.051 | 0.084 | 0.068 | 0.058 | 0.088 | 0.088 | 0.092 | 0.102 | 0.092 | 0.060 | 0.064 | 0.067 | 0.064 | |
| Au (koz) |
0.024 | 1.458 | 2.472 | 6.102 | 10.366 | 11.844 | 4.642 | 2.654 | 3.537 | 2.942 | 2.680 | 9.436 | 7.626 | 11.376 | 3.982 | |
| Pt (koz) |
0.041 | 3.109 | 5.156 | 13.511 | 22.553 | 34.929 | 15.251 | 10.115 | 8.636 | 7.853 | 8.596 | 15.124 | 17.983 | 20.282 | 12.937 | |
| Pd (koz) |
0.038 | 1.500 | 4.223 | 18.343 | 31.352 | 43.774 | 17.256 | 12.274 | 15.145 | 9.746 | 11.897 | 21.892 | 18.767 | 20.659 | 18.034 | |
| Ag (koz) |
– | – | – | – | – | 27.941 | – | – | – | – | – | – | – | – | – | |
Capital and Operating Costs
The Crean Hill Project is a former operating mine site with existing infrastructure such as year-round access, nearby electrical power line grid, and available water sources. Pre-existing infrastructure as well as capital invested prior to the end of 2026 is treated as sunk capital for the purposes of the PFS.
Estimated initial capital is $127.0 million, including $17.9 million of contingency. The estimate comprises capital expenditure from January 1, 2027 to the start of commercial production at the end of Year 3, reflecting the timing of equipment financing (Table 2). Estimated initial capital is presented after equipment financing timing effects. Deferred equipment purchase payments are included in subsequent years. Initial capital is estimated to be $33.0 million in Year 1, $35.0 million in Year 2, and $59.0 million in Year 3. The after-tax cash flow model incorporates the Clean Technology Manufacturing investment tax credits. Eligibility and receipt of those credits remain subject to the applicable requirements and the Company’s tax review. While pre-commercial production operating cash flow and the benefit of refundable tax credits does not reduce the initial capital required, it does help to decrease the net cash outlay at the end of the ramp-up period to an estimated $72.4 million.
Estimated sustaining capital from commercial production at the end of Year 3 onward is $261.7 million.
| Table 2: Crean Hill Initial Capital Costs | |
| Initial Capex | C$ million |
| Mining Capital | |
| Underground development | $35.0 |
| Mobile fleet (after financing timing effects) | $38.9 |
| Underground infrastructure | $8.7 |
| Subtotal | $82.6 |
| Surface Infrastructure Capital | |
| Ventilation | $2.9 |
| Water management | $3.3 |
| Power distribution & substation | $2.9 |
| Backfill plant & reticulation | $4.4 |
| Other surface facilities | $1.9 |
| Subtotal | $26.4 |
| Contingency | $17.9 |
| Total initial capital (Year 1-3)1 | $127.0 |
| Refundable tax credits | -$17.2 |
| Pre-commercial production operating cash flow | -$37.4 |
| Net initial funding | $72.4 |
1 Figures may not sum exactly due to rounding
The Company’s producing McCreedy West Mine is also located in Sudbury and provides an operating cost and productivity benchmark. Average life-of-mine operating costs in the Crean Hill PFS are $152.62 per short ton processed (Table 3). Cash costs are US$3.10/lb payable CuEq and AISC are US$3.55/lb payable CuEq. Cash costs and AISC use the commercial production periods and AISC includes estimated sustaining capital. These are non-GAAP measures and may not be comparable with similarly named measures used by other companies.
| Table 3: Crean Hill PFS Operating Costs | ||
| Operating Costs | LOM | Unit |
| Mining costs | $77.47 | C$/ton shipped |
| Surface & processing costs | $57.04 | C$/ton shipped |
| General & site administration costs | $18.11 | C$/ton shipped |
| Total Operating Costs | $152.62 | C$/ton shipped |
| Total Cash Costs | US$3.10 | US$/lb CuEq payable |
| AISC | US$3.55 | US$/lb CuEq payable |
Project Economics & Sensitivity
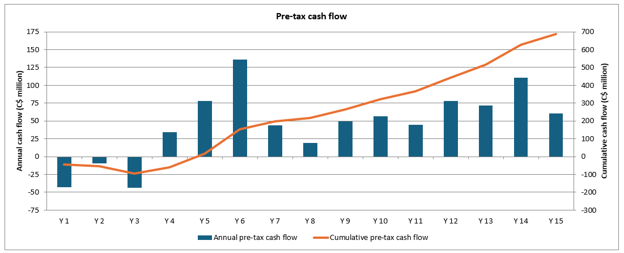
At the base-case prices in Table 4, recovered payable metal value comprises the following revenue share 27.3% copper, 34.4% nickel, 12.4% gold, 12.5% platinum, 12.5% palladium, 0.9% cobalt, 0.1% silver. The average annual revenue during commercial production is $223.4 million while pre-tax cash flows average approximately $65.2 million per year (Figure 4). The Crean Hill PFS base case pre-tax NPV7% is $329.7 million and the after-tax NPV7% is $251.0 million, with an after-tax IRR of 43.4% and payback of 1.5 years. The after-tax NPV7% incorporates the Company’s current tax assumptions, including an estimated benefit of $40.0 million LOM from the Clean Technology Manufacturing investment tax credit. The realization of this tax benefit remains subject to the Company’s ability to satisfy the applicable legislative and tax filing requirements.
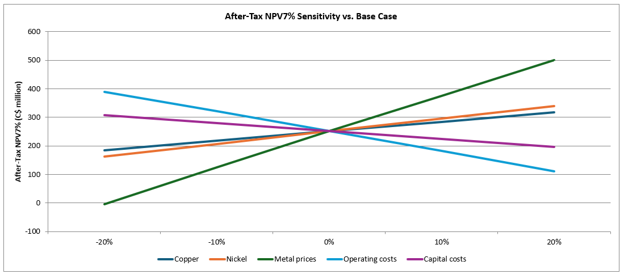
An illustrative spot-price case scenario based on average metal prices during September 2026 returns a pre-tax NPV7% of $554.3 million, an after-tax NPV7% of $406.1 million, an after-tax IRR of 65.4% and payback of 0.8 years. The average annual revenue during commercial production in the spot-price case scenario is $255.1 million while pre-tax cash flows would average approximately $96.2 million per year. Tables 4 and 5 and Figure 5 show fixed mine plan sensitivities. Price-only sensitivities hold the base exchange rate constant; the illustrative spot case applies USD/CAD 0.730 to revenue and U.S. dollar milling charges, with other cost translations held at the base case rate.
The base case after-tax economic results exclude any benefit associated with the PMD tax incentive. For illustrative purposes, a separate tax sensitivity was completed assuming the Company is eligible to claim available PMD deductions on qualifying expenditures. Under this scenario, the base case after-tax NPV7% increases to $256.7 million and the after-tax IRR increases to 45.5%. This legislation remains subject to approval.
Figure 4: Crean Hill PFS Pre-Tax Cash Flow
| Table 4: Crean Hill PFS Economic Summary & Sensitivity Analysis | |||||||||||||||||||||||||||||||||||
| Price Deck | Unit | -10% | Base Case | +10% | Spot Price Case | ||||||||||||||||||||||||||||||
| Copper | US$/lb | $4.59 | $5.10 | $5.61 | $6.65 | ||||||||||||||||||||||||||||||
| Nickel | US$/lb | $7.20 | $8.00 | $8.80 | $7.55 | ||||||||||||||||||||||||||||||
| Gold | US$/oz | $3,240 | $3,600 | $3,960 | $4,400 | ||||||||||||||||||||||||||||||
| Platinum | US$/oz | $1,350 | $1,500 | $1,650 | $1,850 | ||||||||||||||||||||||||||||||
| Palladium | US$/oz | $1,080 | $1,200 | $1,320 | $1,350 | ||||||||||||||||||||||||||||||
| Silver | US$/oz | $40.50 | $45.00 | $49.50 | $65.00 | ||||||||||||||||||||||||||||||
| Cobalt | US$/lb | $18.00 | $20.00 | $22.00 | $22.00 | ||||||||||||||||||||||||||||||
| USD/CAD | x | 0.722 | 0.722 | 0.722 | 0.730 | ||||||||||||||||||||||||||||||
| LOM Economics | |||||||||||||||||||||||||||||||||||
| Revenue LOM | C$ million | $2,572.3 | $2,896.6 | $3,220.8 | $3,300.7 | ||||||||||||||||||||||||||||||
| Operating cash flow LOM | C$ million | $765.0 | $1,079.5 | $1,394.0 | $1,475.6 | ||||||||||||||||||||||||||||||
| Pre-tax cash flow LOM | C$ million | $362.5 | $677.0 | $991.5 | $1,073.1 | ||||||||||||||||||||||||||||||
| After-tax cash flow LOM | C$ million | $291.7 | $507.8 | $723.4 | $779.2 | ||||||||||||||||||||||||||||||
| Annual Averages (Commercial Production) | |||||||||||||||||||||||||||||||||||
| Revenue | C$ million per year | $198.5 | $223.4 | $248.4 | $255.1 | ||||||||||||||||||||||||||||||
| Operating cash flow | C$ million per year | $63.1 | $87.3 | $111.5 | $118.3 | ||||||||||||||||||||||||||||||
| Pre-tax cash flow | C$ million per year | $41.0 | $65.2 | $89.4 | $96.2 | ||||||||||||||||||||||||||||||
| After-tax cash flow | C$ million per year | $33.1 | $49.1 | $65.0 | $69.7 | ||||||||||||||||||||||||||||||
| Net Present Value & IRR | |||||||||||||||||||||||||||||||||||
| Pre-tax NPV7% | C$ million | $149.9 | $329.7 | $509.6 | $554.3 | ||||||||||||||||||||||||||||||
| After-tax NPV7% | C$ million | $125.6 | $251.0 | $375.6 | $406.1 | ||||||||||||||||||||||||||||||
| Pre-tax IRR | % | 23.5% | 42.7% | 62.4% | 65.5% | ||||||||||||||||||||||||||||||
| After-tax IRR | % | 25.1% | 43.4% | 62.8% | 65.4% | ||||||||||||||||||||||||||||||
| Payback | years | 2.3 | 1.5 | .8 | |||||||||||||||||||||||||||||||
| After-tax NPV7% / initial capex | x | 1.0x | 2.0x | 3.0x | 3.2x | ||||||||||||||||||||||||||||||
| After-tax NPV7% with PMD | C$ million | $130.6 | $256.7 | $381.8 | $412.4 | ||||||||||||||||||||||||||||||
| After-tax IRR with PMD | % | 26.6% | 45.5% | 65.5% | 68.0% | ||||||||||||||||||||||||||||||
|
Table 5: Base Case After-tax NPV7% Sensitivity Analysis (C$ million) |
|||||
| Change | -20% | -10% | 0% | 10% | 20% |
| Copper | $183.9 | $217.4 | $251.0 | $284.5 | $317.9 |
| Nickel | $162.8 | $206.9 | $251.0 | $294.9 | $338.7 |
| Metal prices | -$3.7 | $125.6 | $251.0 | $375.6 | $499.2 |
| Operating costs | $389.3 | $320.4 | $251.0 | $181.3 | $111.2 |
| Capital costs | $306.5 | $278.7 | $251.0 | $223.2 | $195.4 |
Figure 5: Sensitivity Analysis
Mining, Processing and Infrastructure
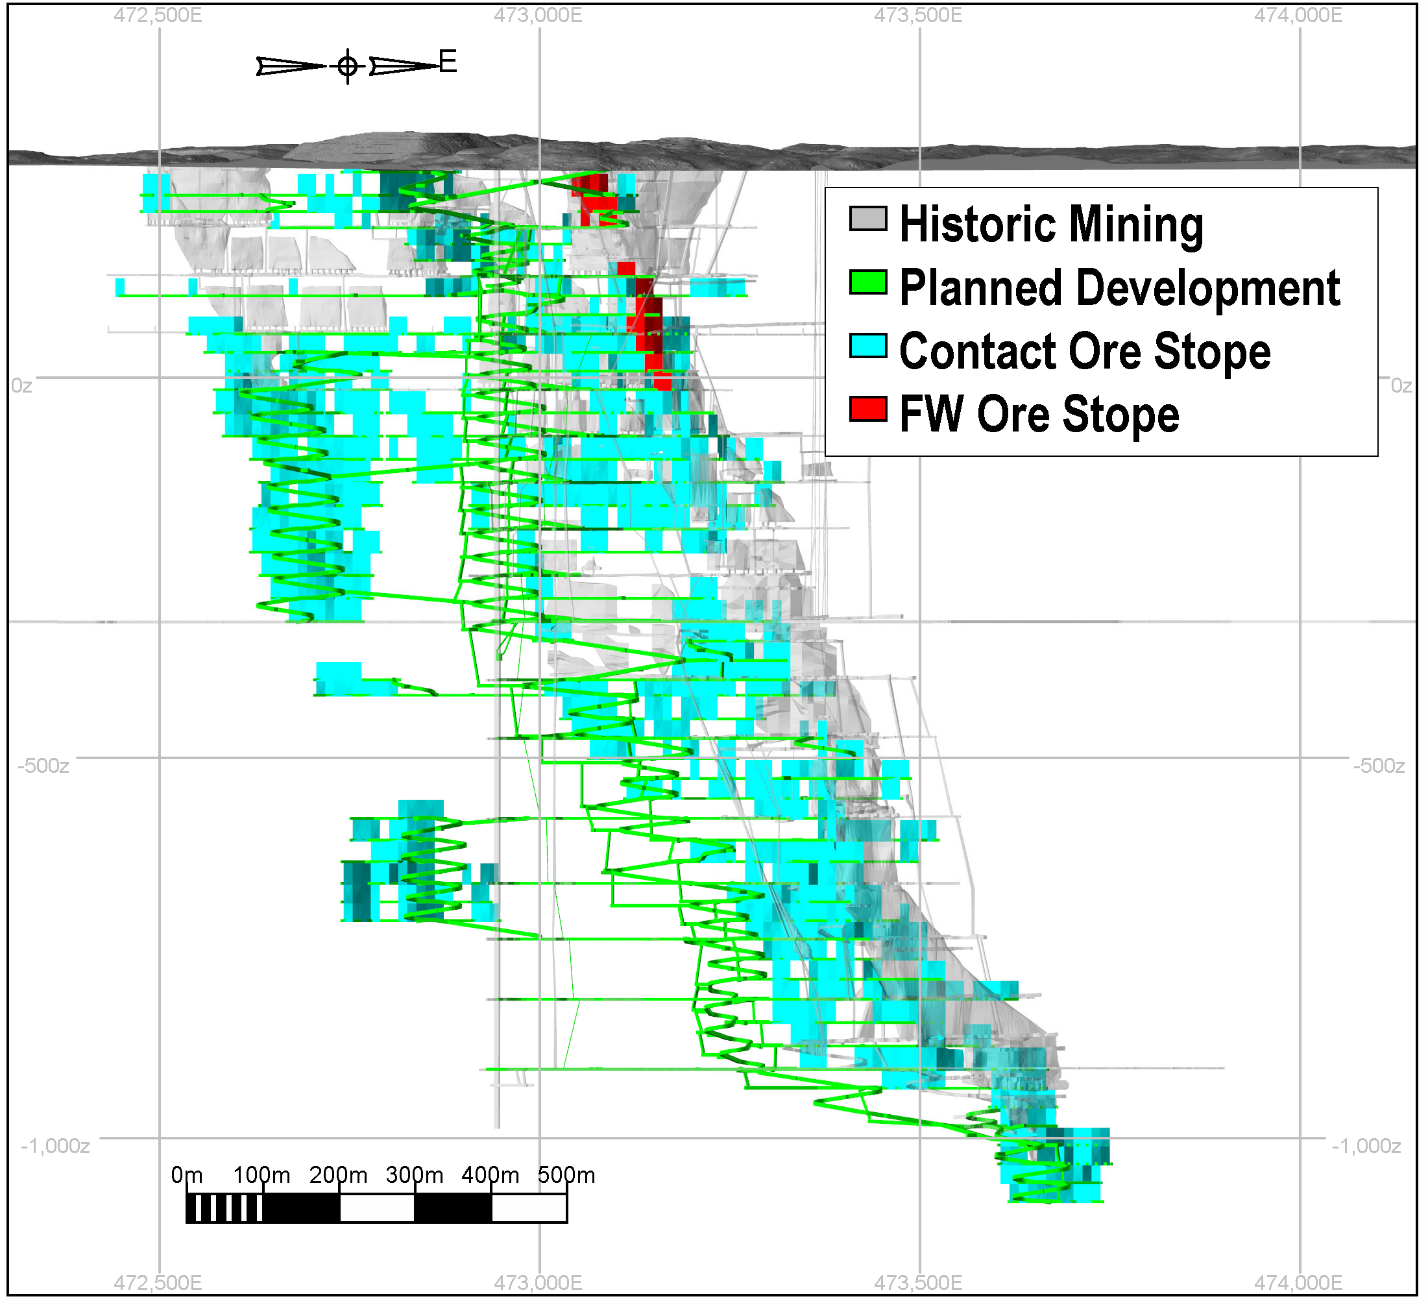
As illustrated in Figure 6, the PFS adopts an underground bulk longhole mining method with access to both transverse and longitudinal stopes via ramps and drifts suitable for medium-to-large-size diesel-powered mobile equipment. Sublevel spacing varies between 80 and 115 feet vertically. Access to the underground workings will be established in a phased approach. Initially, a box cut and portal will be constructed and an access ramp developed to support initial production from the upper portion of the mine. Ore will be generated prior to commercial production from areas above the 500 Level and will rely mostly on repair and rehabilitation of existing ventilation and service raises. Mining above the 2000 Level will rely exclusively on a fleet of 50-ton haul trucks bringing ore, and waste as necessary, to surface up the ramp. As mining progresses deeper, reliance on newly excavated ventilation and egress raises along with the eventual reconstruction of a surface hoisting plant and shaft repair will allow ore to be hoisted from the 2000 Level shaft loading pocket. This will reduce the need for a larger haul truck fleet and the associated mine ventilation upgrade over the life of mine.
Longhole drilling will use self-propelled electric-hydraulic machines, and production blasting will be done with almost exclusively emulsion-type explosives. Mined-out stopes will be backfilled with a combination of unconsolidated rock fill, cemented sand fill and hydraulic fill depending on mining sequence and the availability of suitable waste rock over the course of mine life.
In addition to basic surface infrastructure that will include shop, office and warehousing facilities, a sandfill plant, crushing and sampling tower and eventually a hoist & muck transfer system will be constructed, as well as conventional mine air ventilation and heating infrastructure.
Provision within the life of mine plan has been made for upgrades to the water treatment system associated with discharge to the environment from site. First by the installation of clarifiers to replace the existing pilot plant solids capture system, and eventually a more complex system to manage more complex chemicals.
Once on surface, ore will be reduced to a topsize of 1.5 inches via a contractor-operated surface crusher comprised of a combination of a jaw crusher (until hoisting begins) and cone crusher and then subsampled via the onsite sampling tower with representative subsamples dispatched to the sample preparation and analytical laboratory. Production lots of approximately 2,000 to 4,000 tons of ore will then be shipped to third party milling facilities located in Sudbury, Ontario.
Figure 6: Crean Hill Infrastructure and Geological Zones
Mineral Resources and Mineral Reserves
The Crean Hill Mineral Resource Estimate is presented below in Table 6 and is based on a 1.75% CuEq cutoff grade. The current Mineral Resources have been updated from the November 1, 2024 Mineral Resources stated in the Preliminary Economic Assessment, and have an effective date of April 15, 2026, which is the close out date for the final mine out models (as-builts) used to deplete historical mining. The underlying resource model parameters and drillhole database remains unchanged from the 2024 model, however the cutoff grade has been updated to 1.75% CuEq, based on the metal prices stated below and the model has been depleted with a more detailed mine-out model, to more accurately account for historical mining. Mineral Resources are inclusive of those resources which have been converted to Mineral Reserves. Allan Armitage, Ph.D., P. Geo. of SGS Geological Services is an independent Qualified Person as defined by NI 43-101 and is responsible for the current Crean Hill Mineral Resource Estimate.
|
Table 6: Crean Hill Mineral Resource Estimate |
||||||||||||||
| Deposit Type |
Cut-off Grade CuEq% |
Short Tons |
Metric Tonnes |
Cu % | Ni % | Co % | Pt (g/tonne) |
Pd (g/tonne) |
Au (g/tonne) |
Ag (g/tonne) |
CuEq % | NiEq % | ||
| Indicated | ||||||||||||||
| Contact | 1.75% CuEq | 17,820,000 | 16,171,000 | 0.88 | 1.00 | 0.03 | 0.93 | 1.09 | 0.36 | 1.02 | 2.96 | 1.88 | ||
| Footwall | 1.75% CuEq | 604,000 | 548,000 | 0.74 | 0.41 | 0.01 | 3.18 | 2.59 | 1.38 | 4.25 | 3.62 | 2.31 | ||
| Total Indicated | 1.75% CuEq | 18,424,000 | 16,719,000 | 0.87 | 0.99 | 0.03 | 1.00 | 1.14 | 0.40 | 1.12 | 2.98 | 1.90 | ||
| Inferred | ||||||||||||||
| Contact Inferred | 1.75% CuEq | 884,000 | 802,000 | 0.59 | 0.70 | 0.03 | 1.03 | 1.74 | 0.33 | 0.29 | 2.33 | 1.48 | ||
Crean Hill Mineral Resource Estimate Notes:
|
Table 7: Crean Hill Mineral Reserve Estimate |
|||||||||||
| Deposit Type |
Short Tons |
Metric Tonnes |
Cu % | Ni % | Co % | Pt (g/tonne) |
Pd (g/tonne) |
Au (g/tonne) |
Ag (g/tonne) |
||
| Probable | |||||||||||
| Contact | 10,935,000 | 9,920,065 | 0.62 | 0.68 | 0.02 | 0.92 | 1.08 | 0.38 | 1.00 | ||
| Footwall | 423,861 | 384,520 | 0.55 | 0.31 | 0.01 | 2.35 | 2.15 | 1.04 | 3.20 | ||
| Total Probable | 11,358,861 | 10,304,585 | 0.62 | 0.67 | 0.02 | 0.97 | 1.12 | 0.40 | 1.08 | ||
Crean Hill Mineral Reserve Estimate Notes:
Construction Decision
Based on the results of the PFS prepared in accordance with NI 43-101 Standards of Disclosure for Mineral Projects, authored by independent and experienced Qualified Persons, the Company’s Board of Directors has approved the construction of the Crean Hill Mine. Preliminary work will commence immediately with surface site preparation, detailed engineering, procurement of long lead time items and recruitment of required personnel. The formal start of construction is expected in the first half of 2027.
An exploration diamond drill rig has been mobilized to the Crean Hill Project and has started drill testing new targets for additional footwall copper and precious metals-rich mineralization. Additional assay results will be released in due course.
Technical Report Filing
The technical report in support of the above noted PFS will be filed by Magna Mining within 45 days of this news release.
Qualified Persons
The following Qualified Persons oversaw the completion of the work in preparation of the PFS and are responsible for the contents:
Independent QP for Geology and Mineral Resource Estimates
Mr. Allan Armitage, Ph.D., P.Geo., of SGS Geological Services.
Mr. Armitage conducted a personal inspection of the site on May 25-26, 2022, July 25, 2023, July 02, 2024, July 25, 2024, and November 14, 2025.
Independent QP for Underground Mining and Financial Analysis
Mr. Henri Gouin, P.Eng., of SGS Geological Services.
Mr. Gouin conducted a personal inspection of the site on May 13, 2024 and November 14, 2025.
Independent QP for Underground Mining, Financial Analysis, Permitting and Environmental
Mr. William van Breugel, P.Eng., Associate Engineer of SGS Geological Services.
Independent QP for Processing and Recovery
Mr. David Middleditch, B.Eng., MIMMM, President and Principal Metallurgist of Libertas Metallurgy Limited.
The scientific and technical information in this press release has been reviewed and approved by David King, M.Sc., P.Geo., and Jeff Dawson, P.Eng. Mr. King is the Senior Vice President, Exploration and Geoscience for Magna Mining Inc. and is a qualified person under National Instrument 43-101. Mr. Dawson is the Director, Technical Services for Magna Mining Inc. and is a qualified person under National Instrument 43-101.
About Magna Mining Inc.
Magna Mining Inc. is a producing mining company with a strong portfolio of copper, nickel, and precious metals assets located in the world-class Sudbury mining district of Ontario, Canada. The Company’s McCreedy West Mine is currently in production, the adjacent Levack Mine is being restarted, and construction of the Crean Hill Project has been approved. These operations are supported by a pipeline of highly prospective past-producing properties including Podolsky, Kirkwood and Shakespeare.
Magna Mining is strategically positioned to unlock long-term shareholder value through continued production, exploration upside, and near-term development opportunities across its asset base.
Intersected a new mineralized structure above previously defined ... READ MORE
Canoe Mining Ventures Corp. (TSX-V: CLV) is pleased to announce... READ MORE
HIGHLIGHTS 49 holes and 10,018 metres drilled, two and a half tim... READ MORE
High-Grade Oxide Gold Zone Extends Beyond Current Mineral Resourc... READ MORE
Cerro de Pasco Resources Inc. (TSX-V CDPR) (OTCQX CDPMF) (FRA N8H... READ MORE