








Minaurum Silver Inc. (TSX-V: MGG) (OTCQX: MMRGF) is pleased to report continued high-grade and wide-vein drill results from the Europa, Quintera, Travesia, and San Jose Vein Zones, as part of its ongoing Phase II, 50,000-metre resource-expansion program at the Alamos Silver Project in Sonora, Mexico.
Highlights include: (Drilled Thickness)
“Historically, Quintera was the highest-grade and most productive vein at Alamos. Our drilling now demonstrates that this underexplored zone extends both to depth and along strike beyond the historical workings,” stated Darrell Rader, President and CEO of Minaurum Silver. “These latest results include multiple robust high-grade silver intercepts that underscore Quintera’s potential to become a major contributor to future resource growth at Alamos.”
“At Europa, and particularly within the Europa Sur extension, drilling continues to return high-grade silver mineralization in hanging-wall veins as well as in the main Europa Sur vein. These results continue to validate our exploration model of multiple stacked, high-grade veins at Europa.”
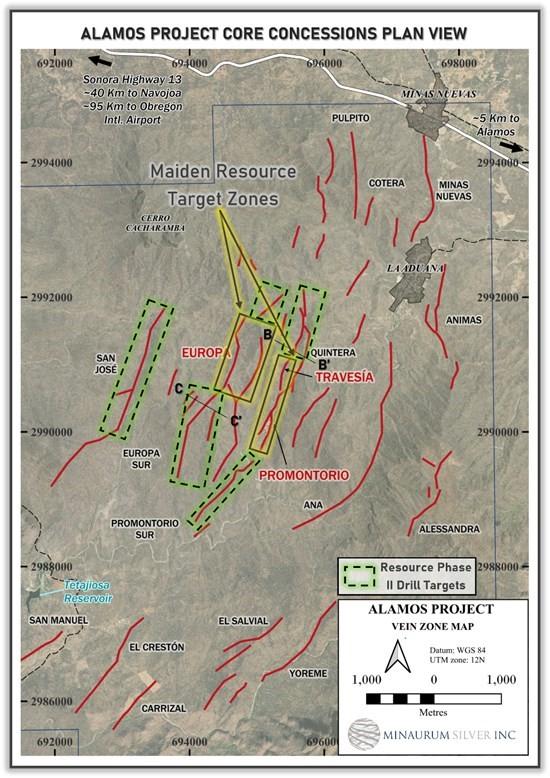
Figure 1. Plan view showing locations of Travesia, Quintera, Promontorio, Europa and San Jose vein zones. Click to enlarge.
Quintera – Travesia Vein Zones
The historic Quintera mine produced an estimated 100 million ounces of silver with development reaching 16 levels to a depth of 500 m along a southwest-plunging shoot. Hole AL26-215 targeted the down-plunge projection of the Quintera vein zone, extending mineralization about 100 m below the significant high-grade results of 5.95 m of 1,117 g/t AgEq, below holes AL26-180 (5.30 m of 633 g/t AgEq: 570 g/t Ag, 0.01 g/t Au, 0.62% Cu, 0.16% Pb, 0.21% Zn) and AL26-188 (5.80 m of 658 g/t AgEq: 581 g/t Ag, 0.06 g/t Ag, 0.33% Cu, 0.87 g/t Pb, 1.08 g/t Zn) (see news release dated March 31, 2026). Assays are pending for hole AL26-206, which was drilled in the northern part of the Quintera vein zone.
Mineralization was intersected at the Travesia vein returning 4.25 m of 133 g/t AgEq (96 g/t Ag, 0.12% Cu, 0.10% Pb, 0.22% Zn) (AL26-202) and 1.20 m of 227 g/t AgEq (143 g/t Ag, 0.10 g/t Au, 0.52% Cu, 0.26% Pb, 0.42% Zn) (AL26-205). See Table 1, Figures 2 – 4.
Further drilling of the Quintera and Travesia zones will include continually targeting down-plunge projections of the southwest-plunging shoots.
Table 1. Assay Highlights for Quintera and Travesia Vein Zones. True widths are based on current interpretation of mineralized structures. Weight-averaged silver-equivalent grades (AgEq g/t) are based on: October 1, 2025 Long-term CIBC Global Mining Group Analyst Consensus Commodity Price Forecast: Ag $29.73/tr oz, Au $2,646/tr oz, Cu $4.34/lb, Pb $0.92/lb, Zn $1.21/lb. Metallurgical recovery assumption: 88.3% for Ag, 88.5% for Au, 75.5% for Cu, 83% for Pb, 75% for Zn.
QUINTERA
| Hole | From (m) |
To (m) |
Interval (m) |
True Width (m) |
Ag g/t |
Au g/t |
Cu % |
Pb % |
Zn % |
AgEq g/t |
| AL26-206 | Assays pending | |||||||||
| AL26-215 | 232.15 | 233.10 | 0.95 | 0.60 | 79 | 0.05 | 0.20 | 0.07 | 0.18 | 127 |
| 441.40 | 449.75 | 5.95 | 3.90 | 953 | 0.04 | 1.21 | 1.58 | 0.41 | 1117 | |
| including | ||||||||||
| 441.40 | 441.70 | 0.30 | 0.20 | 955 | 0.01 | 0.99 | 0.42 | 0.03 | 1074 | |
| and | ||||||||||
| 444.95 | 447.35 | 2.40 | 1.50 | 2204 | 0.10 | 2.83 | 3.83 | 0.98 | 2557 | |
| which includes | ||||||||||
| 444.95 | 445.25 | 0.30 | 0.20 | 7000 | 0.33 | 5.64 | 4.46 | 0.12 | 7626 | |
| and | ||||||||||
| 445.90 | 446.35 | 0.45 | 0.30 | 6780 | 0.23 | 9.41 | 15.80 | 4.25 | 7950 | |
| 448.8 | 449.75 | 0.95 | 0.62 | 98 | 0.00 | 0.66 | 0.02 | 0.02 | 180 | |
| 465.60 | 466.10 | 0.50 | 0.35 | 193 | 0.02 | 0.14 | 0.01 | 0.03 | 210 | |
| 479.15 | 479.55 | 0.40 | 0.25 | 2710 | 0.05 | 0.35 | 0.40 | 0.33 | 2777 | |
TRAVESIA
| Hole | From (m) |
To (m) |
Interval (m) |
True Width (m) |
Ag g/t |
Au g/t |
Cu % |
Pb % |
Zn % |
AgEq g/t |
| AL26-202 | 79.05 | 83.30 | 4.25 | 2.55 | 96 | 0.00 | 0.12 | 0.10 | 0.22 | 133 |
| AL26-205 | 241.90 | 242.50 | 1.20 | 1.00 | 143 | 0.10 | 0.52 | 0.26 | 0.42 | 227 |
| including | ||||||||||
| 242.50 | 243.10 | 0.60 | 0.50 | 204 | 0.19 | 0.83 | 0.23 | 0.78 | 322 | |
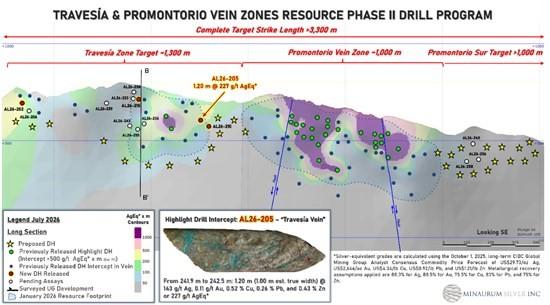
Figure 2. Longitudinal section of Travesia-Promontorio vein zones, showing locations of highlighted mineralized intersections. Click to enlarge.
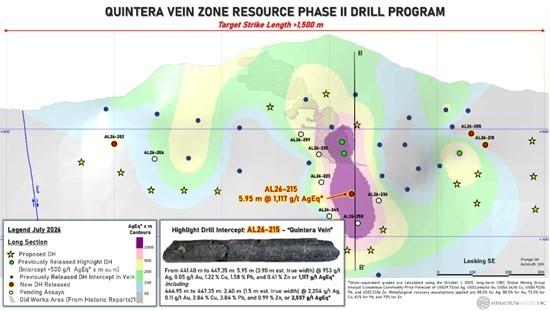
Figure 3. Longitudinal section of Quintera vein zone, showing reported historic mine workings. Click to enlarge.
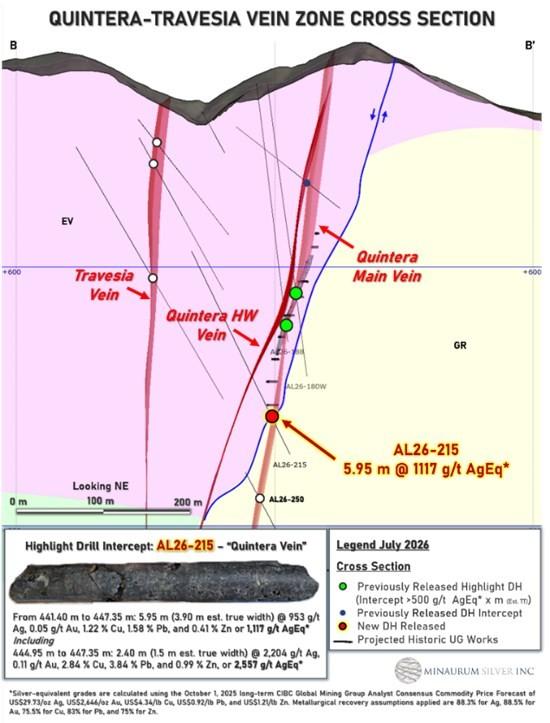
Figure 4. Cross section of Quintera vein zone, showing relationship of holes AL26-215, -188, -180.
Europa Vein Zone
The Europa vein inferred resource constitutes 26.5 Moz AgEq of the total (Europa + Promontorio + Travesia) resource of 55.2 Moz AgEq (34.8 Moz Ag, 35.6 Koz Au, 50.99 Mlbs Cu, 114.77 Mlbs Pb, and 237.80 Mlbs Zn) (see news release dated January 28, 2026). It does not include its southern extension Europa Sur.
Ongoing along-strike and down-dip drilling at Europa Sur continues to expand the zone, returning high-grade silver, gold, copper, and base metals results (Table 2; Figures 5 and 6). Hole AL26-207returned 4.75 m of 888 g/t AgEq (563 g/t Ag, 0.25 g/t Au, 0.80% Cu, 1.17% Pb, 2.04% Zn). Hole AL26-209 cut 0.30 m of 1,699 g/t AgEq (601 g/t Ag, 12.55% Cu).
These results bolster prior Minaurum high-grade intercepts including a wide intercept of 12.35 m of 408 g/t AgEq (318 g/t Ag, 0.09 g/t Au, 0.35% Cu, 1.60% Pb, 0.90% Zn) (AL25-163), and 0.60 m of 828 g/t AgEq (701 g/t Ag, 0.07 g/t Au, 0.34% Cu, 0.52% Pb, 3.39% Zn) (AL26-186), and 3.20 m of 882 g/t AgEq (453 g/t Ag, 1.19 g/t Au, 2.88% Cu, 1.49% Zn, 1.98% Pb) (AL26-196) (see news releases dated February 10, and March 31, and May 27, 2026).
Results to date continue to confirm the potential for significant resource expansion outside of the central Europa vein zone in the Europa Sur extension.
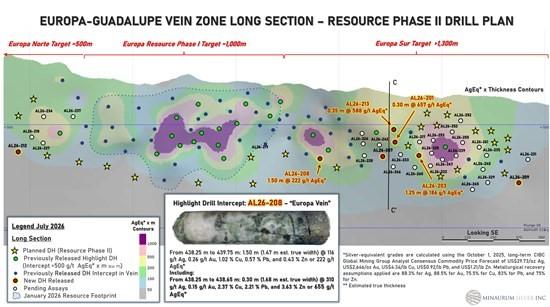
Figure 5. Longitudinal section of Europa-Europa Sur vein zone, showing locations of highlighted mineralized intersections. Click to enlarge.
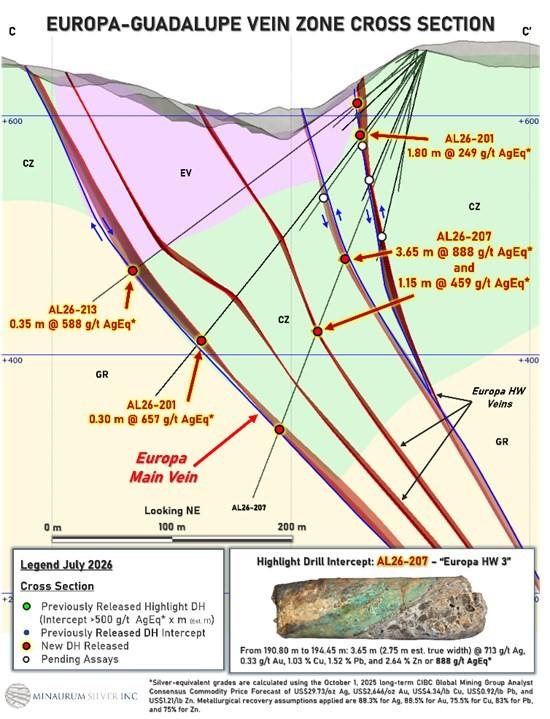
Figure 6. Cross section of Europa-Europa Sur vein zone, showing locations of highlighted mineralized intersections. Click to enlarge.
Table 2. Assay Highlights for Europa Sur Vein Zone. True widths are based on current interpretation of mineralized structures. Weight-averaged silver-equivalent grades (AgEq g/t) are based on: October 1, 2025 Long-term CIBC Global Mining Group Analyst Consensus Commodity Price Forecast: Ag $29.73/tr oz, Au $2,646/tr oz, Cu $4.34/lb, Pb $0.92/lb, Zn $1.21/lb. Metallurgical recovery assumption: 88.3% for Ag, 88.5% for Au, 75.5% for Cu, 83% for Pb, 75% for Zn.
| Hole | From (m) |
To (m) |
Interval (m) |
True Width (m) |
Ag g/t |
Au g/t |
Cu % |
Pb % |
Zn % |
AgEq g/t |
| AL26-201 | 99.55 | 101.35 | 1.80 | 1.70 | 200 | 0.08 | 0.06 | 0.60 | 0.28 | 249 |
| 156.00 | 156.35 | 0.35 | 0.33 | 70 | 0.05 | 0.28 | 0.08 | 0.36 | 126 | |
| 333.10 | 333.40 | 0.30 | 0.29 | 96 | 0.01 | 0.13 | 0.10 | 0.34 | 135 | |
| 334.60 | 334.90 | 0.30 | 0.29 | 583 | 0.02 | 0.55 | 0.06 | 0.23 | 657 | |
| AL26-203 | 180.00 | 180.55 | 0.55 | 0.54 | 76 | 0.02 | 0.12 | 0.14 | 0.39 | 116 |
| 235.55 | 236.60 | 1.05 | 1.30 | 64 | 0.03 | 0.11 | 0.45 | 1.20 | 111 | |
| 238.80 | 239.15 | 0.35 | 0.34 | 230 | 0.03 | 0.10 | 0.47 | 1.36 | 277 | |
| 310.95 | 311.40 | 0.45 | 0.44 | 219 | 0.22 | 0.22 | 0.34 | 0.94 | 289 | |
| 339.20 | 339.55 | 0.35 | 0.34 | 67 | 0.05 | 0.15 | 0.51 | 1.29 | 120 | |
| 376.35 | 377.60 | 1.25 | 1.23 | 121 | 0.03 | 0.40 | 0.18 | 0.72 | 186 | |
| 379.20 | 379.55 | 0.35 | 0.34 | 63 | 0.00 | 0.25 | 0.67 | 1.89 | 125 | |
| 387.55 | 388.20 | 0.65 | 0.64 | 80 | 0.02 | 0.09 | 0.21 | 0.27 | 119 | |
| AL26-207 | 189.70 | 194.45 | 4.75 | 2.75 | 563 | 0.25 | 0.80 | 1.17 | 2.04 | 888 |
| including | ||||||||||
| 191.30 | 193.95 | 2.65 | 2.25 | 841 | 0.44 | 1.23 | 1.98 | 3.43 | 1053 | |
| 196.90 | 197.45 | 0.55 | 0.47 | 95 | 0.00 | 0.09 | 0.13 | 0.21 | 130 | |
| 243.30 | 243.60 | 0.30 | 0.26 | 276 | 0.05 | 0.55 | 0.77 | 1.32 | 369 | |
| 258.00 | 259.15 | 1.15 | 0.98 | 419 | 0.00 | 0.18 | 0.00 | 0.08 | 459 | |
| AL26-208 | 79.30 | 80.85 | 1.55 | 1.52 | 71 | 0.01 | 0.29 | 1.16 | 2.45 | 147 |
| 438.25 | 439.75 | 1.50 | 1.47 | 116 | 0.25 | 0.57 | 0.43 | 1.16 | 222 | |
| including | ||||||||||
| 438.25 | 438.65 | 0.40 | 0.39 | 311 | 0.44 | 0.81 | 0.30 | 1.12 | 451 | |
| AL26-209 | 93.40 | 93.70 | 0.30 | 1.76 | 601 | 0.00 | 12.55 | 0.00 | 0.00 | 1699 |
| AL26-212 | 147.75 | 148.35 | 0.60 | 0.74 | 42.4 | 0.01 | 0.14 | 0.24 | 0.99 | 86 |
| AL26-213 | 75.60 | 77.40 | 1.80 | 0.74 | 66 | 0.08 | 0.35 | 0.45 | 1.03 | 138 |
| 337.30 | 337.65 | 0.35 | 0.34 | 422 | 0.05 | 1.47 | 0.56 | 0.92 | 588 | |
| 378.20 | 378.95 | 0.75 | 1.70 | 121 | 0.03 | 0.61 | 0.37 | 0.54 | 208 | |
| AL26-214 | 99.15 | 99.50 | 0.35 | 0.33 | 3.6 | 0.65 | 0.00 | 0.67 | 1.51 | 101 |
San Jose Vein Zone
Drilling intersected mineralization across a wide width of 8.5 m in Hole AL26-200 returning 111 g/t AgEq (80 g/t Ag, 0.05% Cu, 0.08% Pb, 0.21% Zn) including 1.55 m of 128 g/t AgEq (100 g/t Ag, 0.03% Cu, 0.04% Pb, 0.09% Zn) (Table 3). Results confirm initial Minaurum drilling which also intersected a wide width including 9.6 m of 269 g/t AgEq (198 g/t Ag, 0.02 g/t Au, 0.16% Cu, 0.22% Pb, 0.87% Zn) and 2.05 m of 383 g/t AgEq (181 g/t Ag, 0.06 g/t Au, 0.14% Cu, 1.63 Pb, 1.15% Zn) (AL18-015); 4.05 m of 289 g/t Ag (289 g/t Ag, 0.03 g/t Au, 0.38% Cu, 0.34% Pb, 0.43% Zn) (AL21-92A); and 0.20 m of 764 g/t AgEq (723 g/t Ag, 0.01 g/t Au, 0.24% Cu, 0.08% Pb, 0.70% Zn) (AL26-195) (see new releases dated March 1, 2019, March 1, 2022, and May 27, 2026).
Further drilling at San Jose will continue to define the resource potential along strike while refining our geological understanding of this important vein zone.
Table 3. Assay Highlights for San José Vein Zone. True widths are based on current interpretation of mineralized structures. Weight-averaged silver-equivalent grades (AgEq g/t) are based on: October 1, 2025 Long-term CIBC Global Mining Group Analyst Consensus Commodity Price Forecast: Ag $29.73/tr oz, Au $2,646/tr oz, Cu $4.34/lb, Pb $0.92/lb, Zn $1.21/lb. Metallurgical recovery assumption: 88.3% for Ag, 88.5% for Au, 75.5% for Cu, 83% for Pb, 75% for Zn.
| Hole | From (m) |
To (m) |
Interval (m) |
True Width (m) | Ag g/t |
Au g/t |
Cu % |
Pb % |
Zn % |
AgEq g/t |
| AL26-200 | 267.1 | 275.6 | 8.5 | 7.2 | 80 | 0.00 | 0.05 | 0.08 | 0.21 | 111 |
| including | ||||||||||
| 267.70 | 268.40 | 0.70 | 0.58 | 86 | 0.03 | 0.12 | 0.11 | 0.96 | 127 | |
| 271.65 | 273.20 | 1.55 | 1.32 | 100 | 0.00 | 0.03 | 0.04 | 0.09 | 128 | |
| AL26-204 | 396.05 | 397.95 | 1.90 | 1.75 | 76.6 | 0.01 | 0.02 | 0.05 | 0.20 | 105 |
| AL26-211 | 182.70 | 183.55 | 0.85 | 0.80 | 57.7 | 0.04 | 0.08 | 0.06 | 0.36 | 94 |
Minaurum Silver Inc. is an Americas-focused explorer concentrating on the high-grade 100% owned, production-permitted Alamos silver project in southern Sonora, Mexico and the Lone Mountain CRD Project in Nevada, USA. Minaurum is managed by one of the strongest technical and finance teams and will continue its founders’ legacy of creating shareholder value by acquiring and developing a pipeline of Tier-One precious-and base metal projects.
Scandium Canada Ltd. (TSX-V: SCD) is pleased to announce additional assay results from the 2... READ MORE
Search Minerals Inc. (TSX-V: SMY) (OTC Pink: SHCMF) is pleased to announce that it has closed the th... READ MORE
Golden Spike Resources Corp. (CSE: GLDS) (OTCQB: GSPRF) (FSE: L5Y) is pleased to announce the... READ MORE
GoldHaven Resources Corp. (CSE: GOH) (OTCQB: GHVNF) (FSE: 4QS) is pleased to announce that it has cl... READ MORE
Independence Gold Corp. (TSX-V: IGO) (OTCQB: IEGCF) (FSE: 625) is pleased to announce assay r... READ MORE


