


McEwen Inc. (NYSE:MUX) (TSX: MUX) announced its first quarter financial results for the period ended March 31, 2026, along with an update on its development projects, including an updated Mineral Resource Estimate and strong exploration results across all sites as the Company is advancing its plan to increase production to 250,000 – 300,000 GEOs by 2030.
Based on current gold and silver prices, McEwen believes that if mine operations meet guidance, the Company can self-fund its future production growth with limited share dilution. This will be a key driver behind growing our share price.
Strong Gold Prices Continue to Support Advancement of Key Projects:
Canada
In Canada, McEwen is advancing growth projects to increase production from 16,000 – 19,000 GEOs in 2026 to 105,000 – 120,000 GEOs by 2030. The Company will be developing these projects in a phased approach that is focused on initial capital requirements, IRR and the ability to execute successfully while prioritizing future growth through continued exploration success.
USA
In Nevada, McEwen is forecasting that production will more than double from 39,000 – 43,000 GEOs in 2026 to 90,000 – 110,000 GEOs by 2030, driven by production from Lookout Mountain, Windfall and Trinity Ridge. All three deposits are located within the Gold Bar Mine Complex and management will look to leverage the current infrastructure at site.
The global Resources and Reserves for the Gold Bar Mine Complex are the combined Mineral Resources and Reserves for Gold Bar Mine, Lookout Mountain and Windfall, which now total Indicated Resources of 792,000 gold ounces (38,602,800 tonnes @ 0.64 gpt Au) and Inferred Resources of 281,000 gold ounces (11,256,200 tonnes @ 0.78 gpt Au). This is in addition to Probable Reserves of 168,000 gold ounces (8,624,000 tonnes at 0.61 gpt Au).
Trinity Ridge is the next deposit where a Mineral Resource Estimate is set to be published within the Gold Bar Mine Complex and will look at merging the smaller existing Gold Bar Mine open pits into one e nlarged pit that will capture a meaningful amount of gold mineralization that has not been included in the current Mineral Resource Estimate. Currently, 60% of the planned drilling at Trinity Ridge has been completed and a Mineral Resource update is expected by early 2027.
Mexico
In Mexico, McEwen is forecasting 20,000 GEOs production per year starting mid-2027.
Argentina
Los Azules advanced significantly in 2025, completing two foundational milestones: approval of its application under Argentina’s RIGI (Large Investment Incentive Regime), securing 30 years of legal, fiscal, and customs stability; and publication of a Feasibility Study confirming robust project economics, with initial 5-year average production of 205 ktpa of copper cathodes at $1.71/lb C1 cash cost over a 22-year mine life and identified upside potential to extend mine life for an additional 33 years adding an average of 141ktpa Cu per annum.
Following the Feasibility Study, project costs began to be capitalized in late Q3 2025 under U.S. GAAP. The 2026 objective is to advance the project toward a Final Investment Decision targeted for year-end 2026, with construction targeted to commence in early 2027, and production in 2030, subject to project financing and customary approvals.
Highlights of Q1 2026
Abbreviations used are defined in the Glossary at the end of this press release.
| Revenue | Q1 2026 revenue increased by 107% to $74.0M from the sale of 15,752 GEOs, vs revenue of $35.7M from the sale of 13,036 GEOs in Q1 2025. The average realized gold sale price per GEO was $4,792 in Q1, 71% higher than $2,803 in Q1 2025. Our 49% ownership in the San José mine is excluded from our revenue numbers due to accounting policies under U.S. GAAP. | |
| Profitability | Q1 2026 gross profit was $31.5M, compared with $10.1M in Q1 2025. Gross margins were positively impacted by increased production and higher gold prices. Q1 2026 net income was $33.4M or $0.56 per share, compared with a net loss of $6.3M or $0.12 per share in Q1 2025. | |
| Adjusted EBITDA |
Q1 2026 adjusted EBITDA increased to $44.8M or $0.76 per share, compared with $8.7M or $0.16 per share in Q1 2025.
Adjusted EBITDA is calculated by adding back our portion of McEwen Copper’s results to our consolidated income or loss before financing costs, depreciation, and income and mining taxes. We use adjusted EBITDA to evaluate our operating performance and ability to generate cash flow from our gold operations in production, including the San José Mine. |
|
| Liquidity & Capital Resources at March 31, 2026
|
Cash and equivalents increased to $56.5M, compared with $51.0M at December 31, 2025.
The value of marketable securities decreased to $13.5M, compared with $21.1M at December 31, 2025. The main reason for the decrease is due to McEwen having acquired 100% of Canadian Gold Corp., which had a market value of $5.6M at December 31, 2025. On December 9, 2025, the Company acquired a 27.3% interest in Paragon Advanced Labs, at a cost basis of $13.7M. As of March 31, 2026, the fair value of the investment was $20.4M. As of March 31, 2026, McEwen has loaned $13.6M to McEwen Copper. The most recent financing of McEwen Copper at $30 per share on October 24, 2024 implies a full market value of $987.5M. Based on this valuation, McEwen’s 46.3% ownership of McEwen Copper has an implied market value of $457M or $7.65 per MUX share (based on McEwen’s shares outstanding as of the date of this press release). Since that financing, the project has seen significant development and derisking with the RIGI approval, the completion of the feasibility study, and is now preparing for a Final Investment Decision. Debt principal outstanding remained unchanged at $130.0M ($110.0M in convertible notes due 2030 and $20.0M under our term loan facility). The reported total debt of $126.4M reflects the debt principal of $130.0M, less debt issuance costs of $3.6M, which are amortized over the life of the debt, in accordance with U.S. GAAP. McEwen had 59.2M shares outstanding on March 31, 2026, compared with 55.5M shares on December 31, 2025, mainly due to the shares issued in connection with the acquisition of Canadian Gold Corp. |
&nb sp; |
| San José Mine Performance
|
14,582 GEOs were produced in Q1 and were 33% higher than in Q1 2025. Strong production continued from Q4 2025 and was the result of increased plant capacity and mining rates.
Given the strong production in Q1, production costs per GEO sold were $2,365 for cash costs and $2,704 for AISC, a decrease of 8% and 11%, respectively, compared with Q1 2025. In February, McEwen received an $8.8 M dividend from the San José Mine. Gowing forward, San José intends to pay out 90% of the mine’s cash flow to the partners. At March 31, 2026, the San José Mine held a cash balance of $217.1M versus $151.8M o n December 31, 2025, on a 100% basis. At current gold and silver prices, the Company anticipates receiving $40-$50M in dividend payments from San José in 2026. |
|
| Gold Bar Performance | 7,884 GEOs were produced from the Gold Bar Complex in Q1. Costs were higher than Q1 2025 due to 1) lower mined grades, and 2) increased mining of non-mineralized material. Both factors were anticipated and incorporated into our 2026 planning, and Gold Bar is on track to meet 2026 production and cost guidance.
Costs per GEO sold in Q1 were $2,460 for cash costs and $2,705 for AISC. |
|
| Fox Complex Performance | 5,784 GEOs were produced in Q1. Costs per GEO sold in Q1 were $2,365 for cash costs and $3,148 for AISC. AISC costs were higher compared to prior quarters due to development work completed on the lower levels of Froome West to create access to new mining areas later in the year. This accounted for $778 of the AISC per ounce during the quarter. These costs are expected to trend down through 2026 as required development is completed. | |
| Exploration & Development | $5.5M was invested during Q1 in exploration, compared with $3.7M in Q1 2025. For the full year, the Company is planning to invest $22.2M across its portfolio. Recent exploration highlights are detailed in their respective sections in this news release.
$16.5M was invested by McEwen Copper in the Los Azules copper project in Q1, representing our 46.3% share of costs to advance detailed engineering in preparation of a final investment decision, compared with $18.5M in Q1 2025. As a Mineral Reserve statement with an effective date of September 3, 2025 was published, eligible development costs are now capitalized and will no longer be includ ed in McEwen’s income statement under U.S. GAAP. |
|
| Health & Safety |
On April 3, a contractor working for McEwen Copper at the Los Azules project in Argentina died during road construction when their bulldozer overturned. A full investigation at Los Azules is underway. A second fatality occurred on April 6, at the Gold Bar Mine, where a contractor passed away due to natural causes.
The Company is deeply saddened by these events and extends sincere condolences to the families, friends and colleagues affected by these losses. |
|
| 2026 Production & Unit Costs Outlook |
Full-year 2026 production guidance remains between 114,000 – 126,000 GEOs, including our attributable production from our 49%-owned San José mine and assuming a 77:1 silver-to-gold ratio. Our production guidance does not include early pre-commercial production from the Stock mine.
Cost per ounce guidance range remains unchanged, at $2,100 to $2,300 for cash costs, and $2,400 to $2,600 for AISC. |
|
Mineral Resource & Exploration Update
Gold Bar Mine Complex, Nevada (100% owned)
Update to Mineral Resource Estimate at Gold Bar
The Company is advancing three key areas at its Gold Bar Mine Complex to increase resources, extend mine life and boost annual production: 1) Lookout Mountain, 2) Windfall, and 3) Trinity Ridge, which envisions merging and enlarging several of the current open pits to access gold mineralization outside the current mine plan. McEwen believes that integrating these areas has the potential to transform the Gold Bar Mine Complex into a long-life asset. The Company released a Mineral Resource Estimate for Lookout Mountain with the 2025 year-end financial statements and is now pleased to release a Mineral Resource Estimate for the Windfall deposit located approximately 3 miles (5 km) NE of Lookout Mountain. The Windfall MRE is shown below:
Table 1. Windfall Mineral Resource Estimate – Open Pit Au Cut-off Grade: 0.005 oz/ton oxide
Classification |
Quantity (‘000 tonnes) |
Gold Grade (gpt) |
Contained Gold (oz) |
| Gold Bar Mine Complex: Windfall | |||
| Indicated | 9,402.8 | 0.75 | 227,500 |
| Inferred | 2,596.4 | 1.53 | 127,800 |
Notes to Table 1:
Table 2. Gold Bar Mine Com plex Mineral Resource and Reserve Estimates Updated
| Reserves | Resources | ||||||||
| Probable | Indicated | Inferred | |||||||
| Quantity (‘000 tonnes) |
Gold Grade (gpt) |
Contained Gold (oz) |
Quantity (‘000 tonnes) |
Gold Grade (gpt) |
Contained Gold (oz) |
Quantity (‘000 tonnes) |
Gold Grade (gpt) |
Contained Gold (oz) |
|
| Gold Bar Mine | 8,624 | 0.61 | 168,000 | 9,630 | 0.52 | 162,200 | 1,368 | 0.43 | 19,000 |
| Lookout Mountain | – | – | – | 19,570 | 0.64 | 402,300 | 7,292 | 0.57 | 134,200 |
| Windfall | – | – | – | 9,403 | 0.75 | 227,500 | 2,596 | 1.53 | 127,800 |
| Total | 8,624 | 0.61 | 168,000 | 38,603 | 0.64 | 792,000 | 11,256 | 0.78 | 281,000 |
Note to Table 2: Reserves are as of December 31, 2025; Gold Bar and Lookout Resources are as of December 31, 2025; Windfall Resource as of February 11, 2026.
A Mineral Resource Estimate for Trinity Ridge will be completed separately and released early 2027. Notably, Trinity Ridge lies within the current Plan of Operations for mining activities at the Gold Bar Mine Complex and Windfall is located on private land, which should allow for an accelerated permitting process.
Exploration at Gold Bar
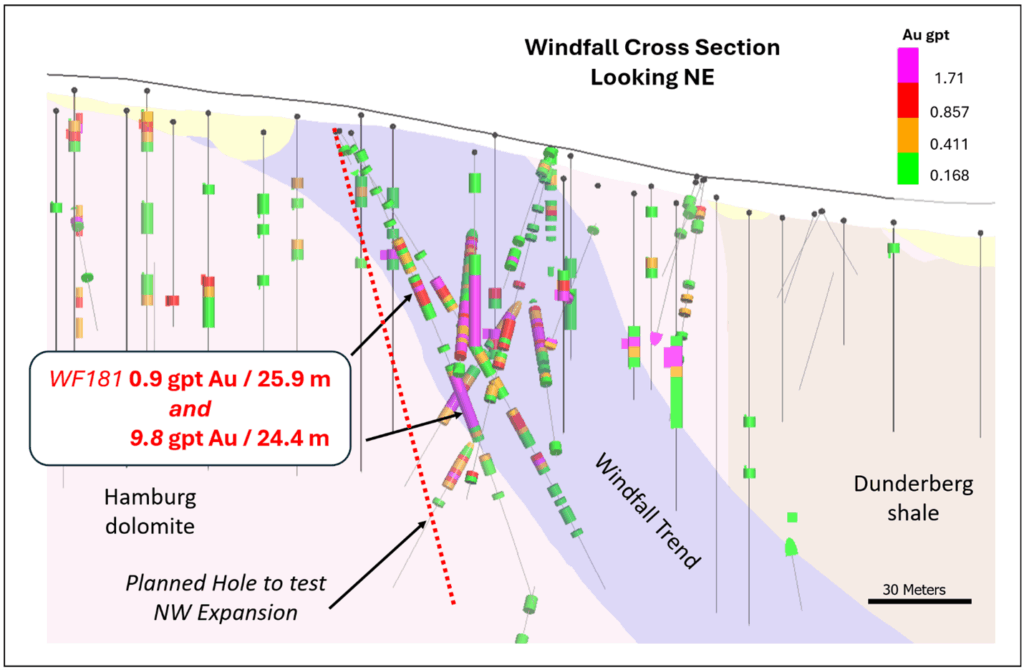
Over the past nine months, drilling at the northern end of the Windfall deposit has been returning good gold grades over long widths. The results highlighted below were received after the effective cut-off date for the Windfall Mineral Resource Estimate. It is also important to note that the results from Windfall continue to show oxide mineralization that could potentially be processed using the same heap leaching technology currently used at the Gold Bar Mine, with McEwen looking to utilize the existing mine infrastructure where possible. Our focus is on return on capital and how efficiently these new ounces can be developed and produced.
Windfall (Fig. 1 and Fig. 2) (RCW = Reverse Circulation Width)
Fig. 1. Plan View of Recent Windfall Drilling
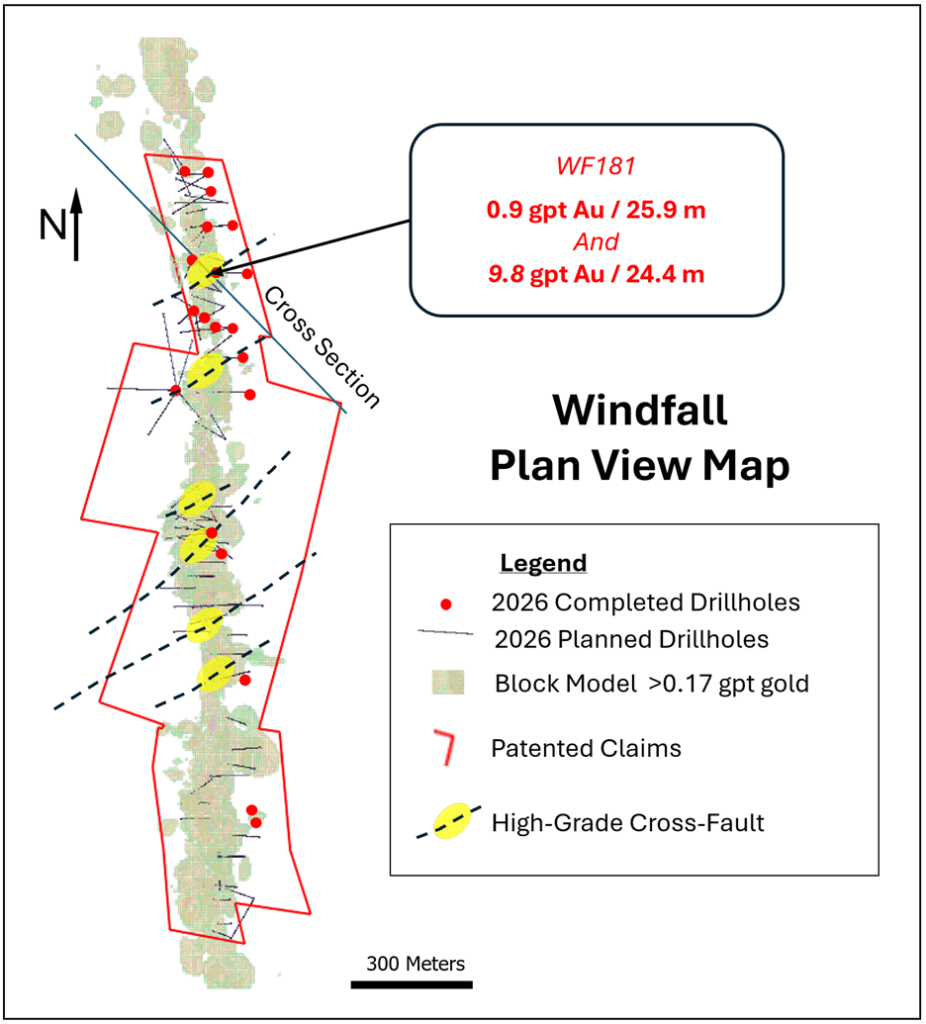
Fig. 2. Windfall Cross Section High-grade Results in Drillhole WF181
Trinity Ridge
At Trinity Ridge, located within the current limits of Gold Bar Mine, the Company is at the early stages of evaluating the potential to expand and merge three existing open pits into one larger pit.
Recent drill results continue to support the Company’s development plans for the area, with highlights shown below:
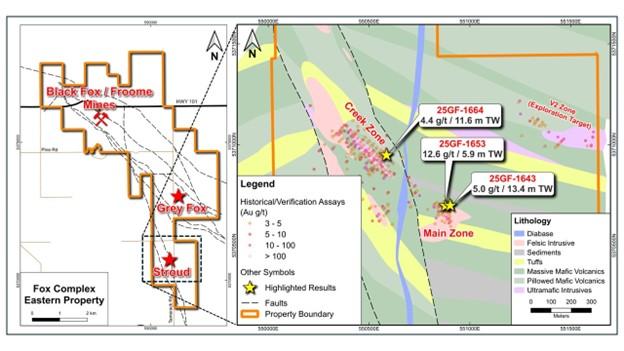
Fox Complex Mine, Ontario (100% owned)
Exploration at Grey Fox (Fig. 3, Fig. 4 and Fig. 5)
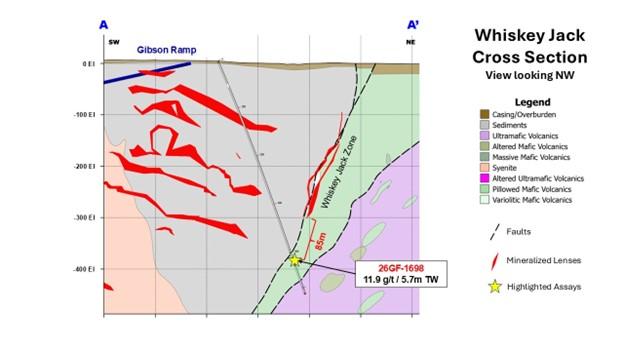
Early in 2026, drilling at Grey Fox focused on the Gibson and Whiskey Jack Zones, where the te am at McEwen believes mining can be accelerated due to their location near existing underground infrastructure.
These new drill results support additional resource growth beyond the pending PFS:
Fig. 3. Gibson and Whiskey Jack Plan View Map
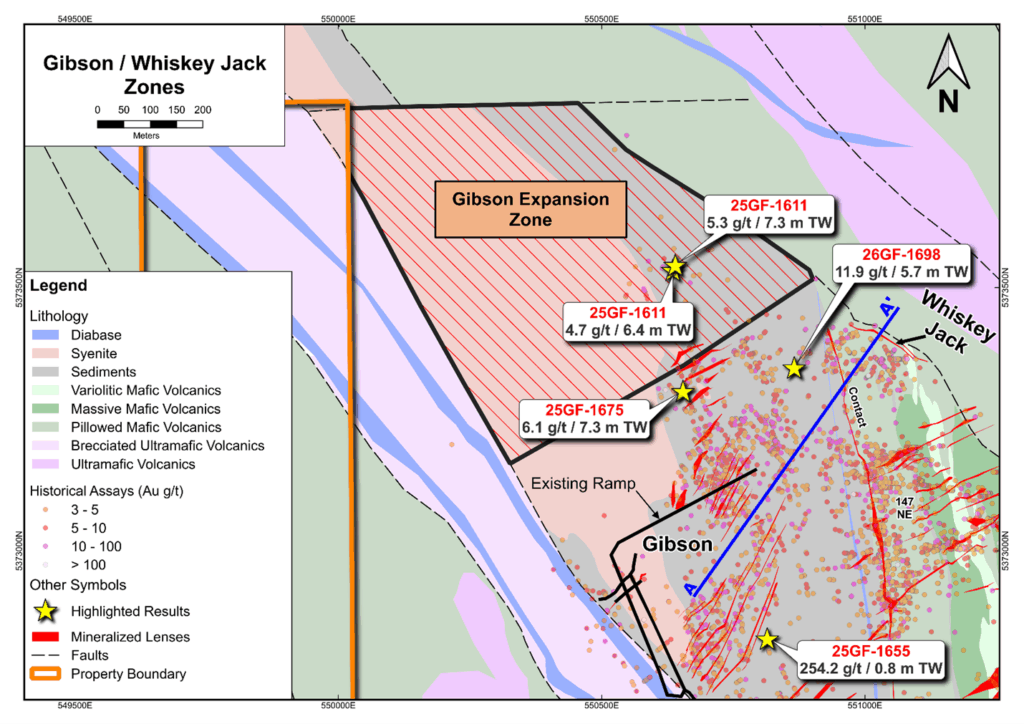
Fig. 4. Whiskey Jack Cross Section
In 2025, McEwen also completed a 6,500-meter drill program at the Stroud deposit that was acquired in 2024. Stroud is located 1,500-meters southwest of the current Grey Fox Mineral Resource area (Fig. 5). The drill program was designed to confirm the historical drilling in order to update the Mineral Resource Estimate, which is set to be released with the Grey Fox PFS.
Drill highlights are shown below:
Fig. 5. Stroud Location and Plan View Map
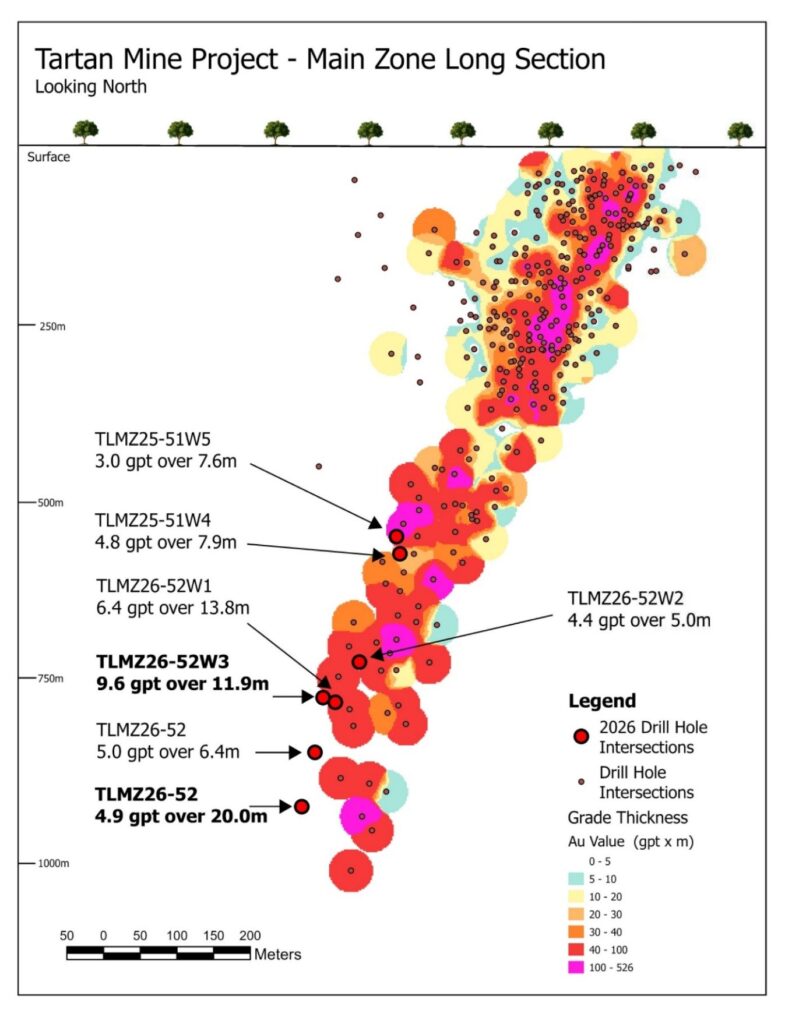
Tartan Mine Project, Manitoba (100% Owned)
Exploration at Tartan (Fig. 6)
On March 23, 2026, the Company released a Mineral Resource Estimate for the Tartan Mine Project that will serve as the foundation for a potential restart of the mine. The underground Mineral Resource Estimate outlined 308,900 gold ounces Indicated (2,619,000 tonnes @ 3.67 gpt gold) and 302,700 gold ounces Inferred (2,832,900 tonnes @ 3.32 gpt gold) with the mineralization open for expansion. New drill results that have been received after the effective cut-off date for the Mineral Resource Estimate highlight further growth potential and are shown below (Fig. 6):
Tartan Potential at Depth (CW = Core Widths)
Expansion Along Western Flank
Fig. 6. Long Section of Tartan’s Main Zone – Selected Drill Highlights
For additional information, a table showing all drill results and locations from our exploration programs at Gold Bar, Fox and Tartan is available on the Company’s website and can be accessed by clicking here.
Table 3. Q1 2026 Production and Costs1, Comparatives from Q1 2025 and 2026 Annual Guidance
| Q1 | Full Year 2026 Guidance |
||||
| 2026 | 2025 | ||||
| Consolidated Production | |||||
| GEOs(2) (3) | 30,471 | 24,132 | 114,000 – 126,000 | ||
| Gold Bar Mine Complex, Nevada | |||||
| GEOs | 7,884 | 7,688 | 39,000 – 43,000 | ||
| Cash Costs/GEO | $2,460 | $1,146 | $2,250 – $2,450 | ||
| AISC/GEO | $2,705 | $2,197 | $2,350 – $2,550 | ||
| Fox Complex, Canada | |||||
| GEOs | 5,784 | 5,520 | 16,000 – 19,000 | ||
| Cash Costs/GEO | $2,365 | $2,061 | $2,200 – $2,400 | ||
| AISC/GEO | $3,148 | $2,504 | $2, 650 –$2,850 | ||
| San José Mine, Argentina (49%)(4) | |||||
| GEOs | 14,582 | 10,924 | 59,000 – 64,000 | ||
| Cash Costs/GEO | $2,365 | $2,575 | $2,000 – $ 2,200 | ||
| AISC/GEO | $2,704 | $3,047 | $2,300 – $2,500 | ||
Notes to Table 3:
Glossary of Terms and Abbreviations
| Au AISC B CW ft FS GEO &nbs p; gpt H1 H2 m M |
– gold – all-in sustaining costs – billion – core width – foot – feasibility study – gold equivalent ounce – grams per tonne – first half of the year (Jan 1 – June 30) – second half of the year (Jul 1 – Dec 31) – meter – million |
oz PFS Q1 RCW Q2 Q3 Q4 t tpd tpa TW |
– troy ounce – pre-feasibility study – first quarter (Jan 1 – Mar 31) – If not followed by a specific year, it references Q1 2026 – reverse circulation width – second quarter (Apr 1 – June 30) – third quarter (Jul 1 – Sep 30) – fourth quarter (Oct 1 – Dec 31) – tonne – tonnes per day – tonnes per annum – true width |
ABOUT MCEWEN
McEwen provides its shareholders with exposure to a growing base of gold, and silver production in addition to a very large copper development project, all in the Americas. The gold and silver mines are in prolific mineral-rich regions of the world: the Cortez Trend in Nevada, USA, the Timmins district of Ontario and Flin Flon in Manitoba, Canada, and the Deseado Massif in Santa Cruz province, Argentina. McEwen is also reactivating its gold and silver El Gallo Mine in Mexico.
The Company has a 46.3% interest in McEwen Copper, which owns the large, long-life, advanced-stage Los Azules copper development project in San Juan province, Argentina – a region that hosts some of the country’s largest copper deposits. According to the last financing for McEwen Copper, the implied value of McEwen’s ownership interest is US$456 million.
The Los Azules copper project is desig ned to be one of the world’s first regenerative copper mines and carbon neutral by 2038. Its Feasibility Study results were announced in the press release dated October 7, 2025.
McEwen also recently purchased 27.3% of Paragon Advanced Labs Inc., a newly listed public company that is deploying PhotonAssay™ units around the world, a technology that the Company believes is poised to become the new industry standard for assaying precious and base metals, with Paragon aiming to be one of the leading service providers.
Chairman and Chief Owner Rob McEwen has invested&n bsp;over US$250 million personally and takes a salary of $1 per year, aligning his interests with shareholders. He is a recipient of the Order of Canada, a member of the Canadian Mining Hall of Fame and a winner of the EY Entrepreneur of the Year (Energy) award. His objective is to build MUX’s profitability, share value, and ultimately implement a dividend policy, as he did while building Goldcorp Inc.
American Pacific Mining Corp. (CSE: USGD) (OTCQX: USGDF) (... READ MORE
Saw-cut sampling returned 20.2 g/t gold over 5.0 meters at surfac... READ MORE
All amounts are expressed in US dollars, tabular amounts in milli... READ MORE
Record Quarterly Earnings and Free Cash Flow Generation Lund... READ MORE


