


Doubleview Gold Corp (TSX-V: DBG) (OTCQB: DBLVF) (FSE: 1D4) is pleased to announce the results of its Preliminary Economic Assessment of its 100%-owned polymetallic Hat porphyry project, in northwestern British Columbia. With major content of copper, gold, cobalt, silver, and scandium, Hat becomes an important source of critical minerals.
Three processing scenarios were evaluated-Scenario A1 (A1) a Cu-Au-Ag-Co flotation base case using current testwork recoveries[1], Scenario A2 (A2), the same base case using expected recoveries1, and Scenario B (B), a Cu-Au-Ag-Co flowsheet with an added hydrometallurgical circuit and scandium recovery circuit-with results indicating the Project is financially attractive even without the scandium component.
Highlights:
Farshad Shirvani, President and CEO of Doubleview Gold Corp., commented, “The results of this PEA confirm the scale, strength and long-term potential of the Hat Project. Delivering a post-tax NPV(5%) of up to C$6.94 billion and IRR of up to 23% at consensus prices, and even stronger metrics at spot prices, validates years of disciplined exploration and technical work by our team. Hat is demonstrating Tier 1 characteristics with a 25-year mine life, strong annual production profile and meaningful free cash flow generation. Importantly, the Project stands on its own without reliance on scandium, while still preserving significant upside from critical minerals as markets mature. We are excited to advance Hat to Pre-Feasibility and continue building a major Canadian critical metals project.”
Doubleview acknowledges that the Project is located on the traditional territories of the Tahltan Nation and the Taku River Tlingit First Nation, and recognizes their enduring relationship to and stewardship of the land and waters. Doubleview is committed to respectful, transparent, and ongoing engagement with First Nations and local communities whose territories overlap the Project area and access routes, with a focus on protecting water and the environment and advancing responsible development.
PEA OVERVIEW
The PEA contemplates a conventional open-pit mine and processing operation with a 25-year mine life at a 120,000 t/d (42 Mt/a) plant throughput. Two processing pathways were evaluated, A1 and its alternative, A2, and B: the first alternative, A, is a Cu-Au-Ag-Co flotation concentrator with two recovery cases based on current metallurgical testwork, and A2, reflecting expected performance (Figure 1); and B, a full circuit that retains the base flowsheet and adds a downstream hydrometallurgical scandium recovery circuit (Figure 2).
The tailings storage facility is a centreline-raised facility built with compacted cycloned sand from tailings underflow, and engineered drainage for stability, with site-contact waters (including seepage and pit dewatering) recycled to the process plant and final closure involving pond drainage and reclamation. The Project is expected to rely on grid power via an extended transmission line.
Tables 1 to 3 summarize the key results of the PEA, including production, operating costs, capital expenditures, and the principal financial metrics; the sections that follow provide additional detail on the underlying assumptions, project design, and study outcomes.
Table 1: PEA Study Summary-Production
| Metric | Unit | Scenario A1 | Scenario A2 | Scenario B |
| Mining Summary | ||||
| Strip ratio | t:t | 1.60 | ||
| Production Summary LOM | ||||
| Average Annual Throughput | Mt | 42 | ||
| CuEq Head Grade[6], [7] | % | 0.42 | ||
| Cu Head Grade | % | 0.19 | ||
| Au Head Grade | g/t | 0.19 | ||
| Ag Head Grade | g/t | 0.51 | ||
| Co Head Grade | g/t | 0.78 | ||
| Sc Head Grade6 | g/t | 28.35 | ||
| Cu Recovery | % | 80 | 89 | 85[8] |
| Au Recovery | % | 66 | 75 | 898 |
| Ag Recovery | % | 53 | 53 | 688 |
| Co Recovery | % | 30 | 30 | 788 |
| Sc Recovery | % | N/A | 728 | |
| Overall Mass of Tailings to Process[9] | % | N/A | 12.5 | |
| Year of Production Start of Sc2O38 | year | N/A | 4 | |
| Average Annual Cu Production | kt | 63.6 | 70.8 | 67.6 |
| Total Cu Production | kt | 1,590.5 | 1,769.4 | 1,689.9 |
| Average Annual Payable Cu | kt | 61.7 | 68.7 | 65.7 |
| Total Payable Cu | kt | 1,542.8 | 1,716.3 | 1,642.2 |
| Average Annual Au Production | koz | 161.1 | 183.1 | 217.3 |
| Total Au Production | koz | 4,028.2 | 4,577.5 | 5,432.0 |
| Average Annual Payable Au | koz | 153.1 | 173.9 | 207.5 |
| Total Payable Au | koz | 3,826.8 | 4,348.7 | 5,188.6 |
| Average Annual Ag Production | koz | 271.3 | 271.3 | 348.0 |
| Total Ag Production | koz | 6781.6 | 6,781.6 | 8,700.9 |
| Average Annual Payable Ag | koz | 244.1 | 244.1 | 318.6 |
| Total Payable Ag | koz | 6,103.4 | 6,103.4 | 7,965.3 |
| Average Annual Co Production | kt | 1.0 | 1.0 | 2.5 |
| Total Co Production | kt | 23.9 | 23.9 | 62.2 |
| Average Annual Payable Co | kt | 0.8 | 0.8 | 2.3 |
| Total Payable Co | kt | 19.1 | 19.1 | 56.3 |
| Average Annual Sc2O3 Production | t | N/A | 128.4 | |
| Total Sc2O3 Production | t | N/A | 3,209.5 | |
| Total Sc2O3 Payable | t | N/A | 3,049.0 | |
Table 2: PEA Study Summary-Operating Cost
| Metric | Unit | Scenario A1 | Scenario A2 | Scenario B |
| Operating Cost | ||||
| Average Mine Operating Costs | C$/t-moved | 2.32 | ||
| Average Mine Operating Costs | C$/t-milled | 6.03 | ||
| Processing Operating Cost[10] | C$/t-milled | 7.93 | 7.93 | 10.84 |
| Sc2O3 Processing Cost[11] | C$/kg Sc2O3 | N/A | 939.55 | |
| General & Administrative | C$/t-milled | 2.56 | 2.56 | 2.56 |
| Total Operating Costs | C$/t-milled | 16.22 | 16.22 | 22.96 |
Table 3: PEA Study Summary-Capital Expenditure and Financial Metrics
| Metric | Unit | Scenario A1 | Scenario A2 | Scenario B |
| Capital Expenditure | ||||
| Initial Capital Costs | C$M | 3,552 | 3,601 | 3,828 |
| Sustaining Capital Costs | C$M | 2,755 | 2,755 | 4,006 |
| Closure and Reclamation Cost | C$M | 503 | ||
| Financial Metrics | ||||
| Exchange Rate | CAD/USD | 1.37 | ||
| Long Term Copper Price | US$/lb | 4.88 | ||
| Long Term Gold Price | US$/oz | 3,272.60 | ||
| Long Term Silver Price | US$/oz | 50.22 | ||
| Long Term Cobalt Price | US$/lb | 19.57 | ||
| Long Term Scandium Oxide Price | US$/kg | N/A | 1,500 | |
| Average Annual EBITDA | C$M | 886 | 1,071 | 1,242 |
| Total EBITDA | C$M | 22,162 | 26,770 | 31,041 |
| Average Annual Free Cash Flow (Pre-tax) | C$M | 756 | 940 | 1,061 |
| Free Cash Flow (Pre-tax)[12] | C$M | 18,904 | 23,511 | 26,532 |
| Total Provincial Tax (inc. BC Mineral Tax) | C$M | (4,029) | (5,090) | (5,772) |
| Total Federal Tax | C$M | (1,274) | (1,859) | (2,170) |
| Total Taxes | C$M | (5,303) | (6,949) | (7,942) |
| Average Annual Free Cash Flow (Post-tax) | C$M | 544 | 662 | 744 |
| Free Cash Flow (Post-tax)12 | C$M | 13,601 | 16,562 | 18,591 |
| Total Free Cash Flow (Pre-tax)[13] | C$M | 15,352 | 19,910 | 22,704 |
| Total Free Cash Flow (Post-tax)12 | C$M | 10,050 | 12,961 | 14,763 |
| NPV 5% (Pre-tax) | C$M | 7,883 | 10,576 | 11,043 |
| NPV 5% (Pre-tax) | US$M | 5,754 | 7,720 | 8,061 |
| IRR (Pre-tax) | % | 24 | 29 | 23 |
| Payback (Pre-tax) | years | Year 5 | Year 4 | Year 6 |
| NPV 5% (Post-tax) | C$M | 4,963 | 6,727 | 6,937 |
| NPV 5% (Post-tax) | US$M | 3,623 | 4,911 | 5,064 |
| IRR (Post-tax) | % | 19 | 23 | 19 |
| Payback (Post-tax) | Years | Year 6 | Year 5 | Year 7 |
Table 4 shows the Sensitivity analysis using after-tax NPV(5%) and after-tax IRR.
Table 4: Sensitivity Analysis
| Variable | Case (%) |
Metal Price | Scenario A1 | Scenario A2 | Scenario B | |||
| NPV (5%) C$M |
IRR (%) |
NPV (5%) C$M |
IRR (%) |
NPV (5%) C$M |
IRR (%) |
|||
| Base Case | Consensus forecast | 4,963 | 19 | 6,727 | 23 | 6,937 | 19 | |
| Copper Price | -20 | US$3.90/lb Cu | 3,218 | 15 | 4,807 | 19 | 5,094 | 15 |
| Copper Price | +20 | US$5.86/lb Cu | 6,688 | 23 | 8,632 | 28 | 8,764 | 22 |
| Gold Price | -20 | US$2,618.08/oz | 3,625 | 16 | 5,223 | 19 | 5,201 | 16 |
| Gold Price | +20 | US$3,927.12/oz | 6,289 | 22 | 8,222 | 27 | 8,661 | 22 |
| Metal Prices | -20 | All metal prices | 1,708 | 10 | 3,165 | 14 | 2,650 | 11 |
| Metal Prices | +20 | All metal prices | 8,118 | 27 | 10,233 | 32 | 11,110 | 26 |
| Initial CAPEX | +20 | Variable per Scenario | 4,448 | 16 | 6,222 | 19 | 6,394 | 16 |
| OPEX | +20 | Variable per Scenario | 3,660 | 16 | 5,438 | 20 | 5,185 | 16 |
| Scandium Oxide Price | -40 | US$900/kg Sc2O3 | 6,159 | 18 | ||||
| Scandium Oxide Price | +40 | US$2,100/kg Sc2O3 | 7,714 | 20 | ||||
MINERAL RESOURCE ESTIMATE
Doubleview Gold Corp announced an update of the Mineral Resource estimate (MRE). This estimate followed the Micon International Ltd. (Micon) Mineral Resource estimate with an effective date of July 17, 2024. This MRE incorporates significant new data from the 2024 and 2025 exploration campaigns, with an effective date of February 4, 2026, and superseded the 2024 Micon estimate.
Table 5: Hat MRE at a 0.2% CuEq Cut-Off Effective February 4, 2026
| Mineral Resource Classification |
Tonnage (Mt) |
Average Grade | Metal Content | ||||||||
| CuEq (%) |
Cu (%) |
Au (g/t) |
Co (g/t) |
Ag (g/t) |
CuEq (Blb) |
Cu (Blb) |
Au (Moz) |
Co (Mlb) |
Ag (Moz) |
||
| Measured | 272 | 0.44 | 0.22 | 0.18 | 76.26 | 0.37 | 2.61 | 1.11 | 1.41 | 35.6 | 2.17 |
| Indicated | 337 | 0.43 | 0.21 | 0.19 | 76.81 | 0.39 | 3.21 | 1.31 | 1.81 | 44.5 | 2.88 |
| Total M+I | 609 | 0.43 | 0.21 | 0.18 | 76.57 | 0.38 | 5.82 | 2.42 | 3.22 | 80.1 | 5.05 |
| Inferred | 503 | 0.41 | 0.18 | 0.19 | 76.62 | 0.38 | 4.57 | 1.72 | 2.77 | 66.2 | 4.19 |
Table 6: Hat MRE at a 0.2% CuEq Cut-Off as of February 4, 2026, Scandium Oxide Resources
| Mineral Resource Classification |
Tonnage (Mt) |
Sc Tonnage1 (Mt) |
Average Grade Sc (g/t) |
Metal Content Sc2O3 2 (t) |
| Measured | 272 | 34 | 28.79 | 1,081 |
| Indicated | 337 | 42 | 28.76 | 1,334 |
| Total M+I | 609 | 76 | 28.77 | 2,415 |
| Inferred | 503 | 63 | 28.69 | 1,996 |
Notes:
1 Scandium tonnages represent 12.5% of the mineralized material by category, reflecting the proportion of tailings expected to be processed through a dedicated scandium leach circuit under current metallurgical design constraints.
2 Scandium oxide metal content have been calculated using the metallurgical recovery of 72% and conversion factor from Sc to Sc2O3 of 1.534.
PROCESSING SCENARIOS
The PEA evaluates two processing scenarios: (A) a conventional Cu-Au-Ag-Co flotation concentrator at 120,000 t/d (42 Mt/a) with two recovery cases-A1 based on metallurgical testwork completed by Sepro Laboratories (Langley, BC) and A2 reflecting target/expected performance-and (B) a full circuit that retains the base flowsheet and adds a downstream hydrometallurgical scandium recovery circuit.
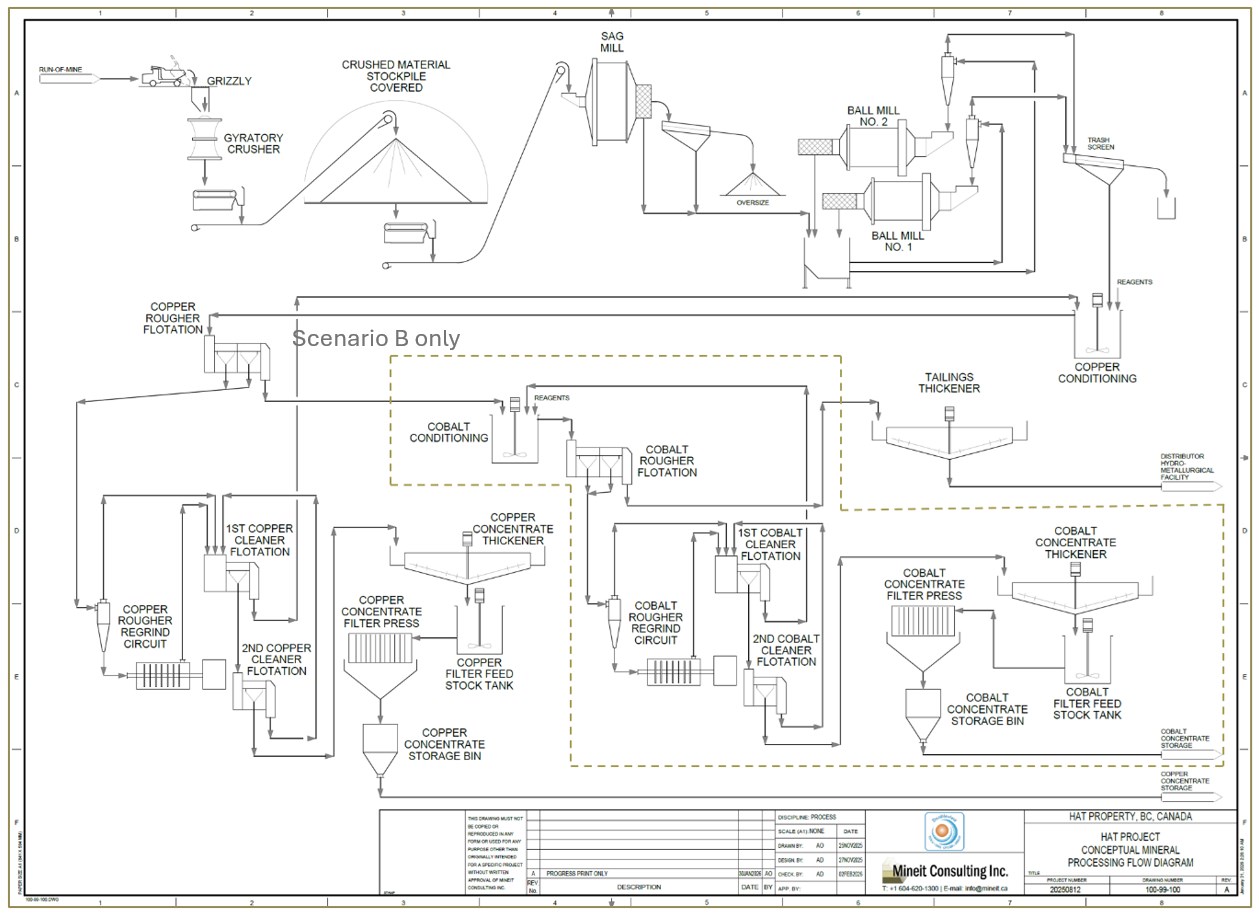
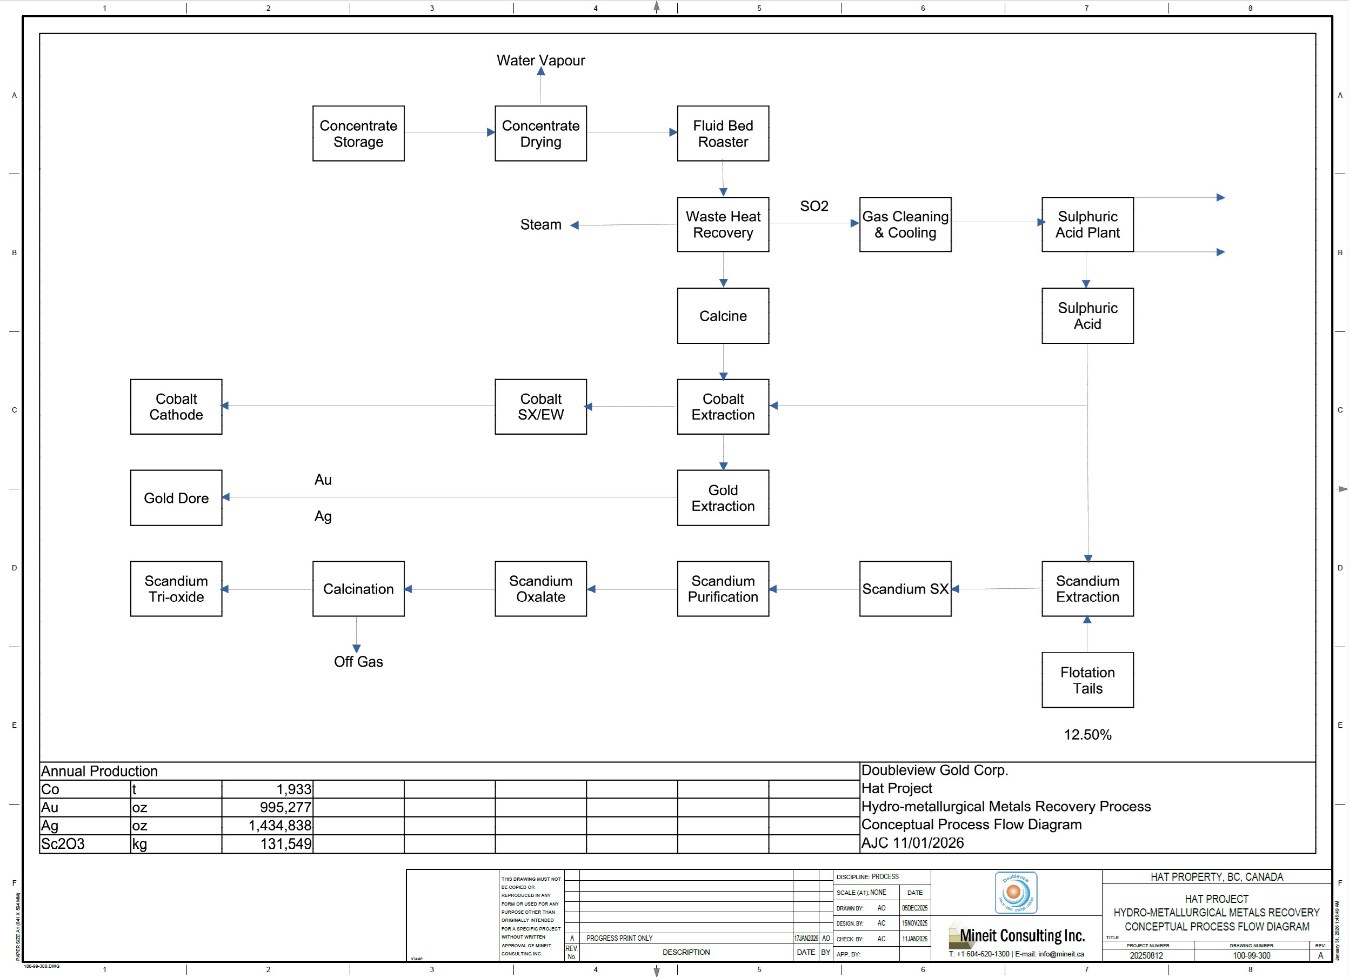
The concentrator consists of crushing, grinding, flotation, concentrate handling, and tailings management, producing both a saleable approximately 25% Cu concentrate with co-product gold and by-product silver-cobalt credits and a pyrite concentrate enriched in cobalt; in the full-circuit case, the pyrite concentrate is roasted to generate sulphuric acid and a calcine that is then processed to recover cobalt, gold, silver, and copper; after stripping it will be precipitated as a sulphide to be admixed to the copper concentrate to improve grade, with the acid used to leach flotation tailings for scandium recovery, noting that the scandium circuit is a newer chemical process compared with the otherwise industry-standard flowsheet.
Under A1 or A2 (Figure 1), the flowsheet produces a single saleable product-a copper concentrate with payable gold credits; the pyrite concentrate is not treated or marketed in this case and is only processed in B where the hydrometallurgical circuit enables recovery of cobalt (and additional Au-Ag) and supports the scandium circuit (Figure 2), which is planned to be constructed in a phased approach commencing in Year 3 of operations.
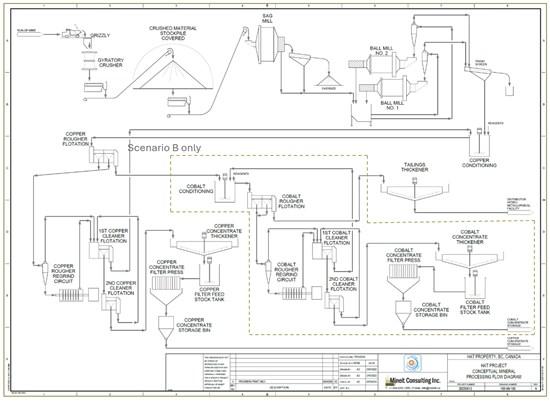
Figure 1: Grinding and Flotation Flowsheet; Scenarios A1/A2 Report Copper Concentrate Only, while the Cobalt-Pyrite Flotation Stream Shown Is Included Only in Scenario B
To view an enhanced version of this graphic, please visit:
https://images.newsfilecorp.com/files/8003/285945_7d43165cf4f1bb4d_001full.jpg
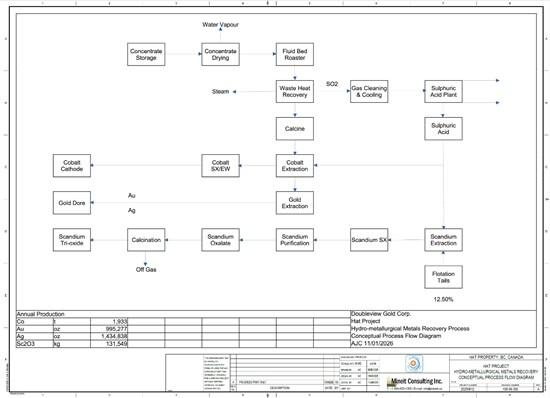
Figure 2: Scenario B Hydrometallurgical Plant Block Flow Diagram, Showing Downstream Treatment of the Cobalt-Pyrite Stream and Flotation of Tailings to Recover Cobalt (and Au-Ag) and Scandium, Including Sulphuric Acid Generation to Support the Scandium Circuit
To view an enhanced version of this graphic, please visit:
https://images.newsfilecorp.com/files/8003/285945_7d8c82e63416eab6_003full.jpg
Table 7 summarizes the head grades, concentrate grades, and overall metallurgical recoveries from early testwork for the full circuit; A1 assumes only the reported recoveries to the Cu-Au concentrate, while the cobalt-pyrite concentrate and downstream recoveries are considered only in B.
Table 7: Attainable Recovery from Testwork
| Product | Grade | Recovery | ||||||
| Copper (%) |
Cobalt (ppm) |
Gold (g/t) |
Silver (g/t) |
Copper (%) |
Cobalt (%) |
Gold (%) |
Silver (%) |
|
| Head Grade | 0.21 | 132 | 0.34 | 2.9 | – | – | – | – |
| Copper-Gold Concentrate | 25 | 1160 | 12 | 68 | 80 | 30 | 66 | 53 |
| Cobalt-Pyrite Concentrate | 0.30 | 1605 | 2 | 8 | 5 | 48 | 23 | 15 |
| Combined Concentrates | – | – | – | – | 85 | 78 | 89 | 68 |
| Tailings | 0.05 | 40 | 0.05 | 1.0 | 15 | 22 | 11 | 32 |
Early metallurgical testwork comprised metallurgical characterization studies under standard laboratory conditions to demonstrate metals recoverability for inclusion in the estimate of CuEq. No attempt was made to optimize flotation conditions, and more advanced flotation testwork was not undertaken. Consequently, the reported metallurgical recoveries are considered conservative, and it is reasonable to expect improvement with further testwork.
A2, assumes improved copper and gold recoveries of 89% and 75%, respectively, reflecting expected performance from comparable Cu-Au porphyry flotation circuits following further optimization and testwork.
Table 8 summarizes the recoveries assumption on each scenario.
Table 8: Net Recovery for Each Scenario
| Net Recovery | Scenario A1 | Scenario A2 | Scenario B |
| Cu Recovery | 80% | 89% | 85% |
| Au Recovery | 66% | 75% | 89% |
| Ag Recovery | 53% | 53% | 68% |
| Co Recovery | 30% | 30% | 78% |
CAPITAL COST SUMMARY
Table 9 presents the estimated capital cost breakdown for the three evaluated scenarios, separating initial CAPEX from sustaining CAPEX and reporting costs in C$M by major cost area (processing plant, mining, pre-stripping, infrastructure, tailings and water management, Indirects/EPCM, and contingency).
Total initial CAPEX is estimated at C$3,552 million (A1), C$3,601 million (A2), and C$3,828 million (B), reflecting the higher processing plant scope and associated indirects/contingency in Scenario B.
Total sustaining CAPEX is estimated at C$2,755 million (A1/A2) and C$4,006 million (B), with the increase in B driven primarily by the inclusion of the hydrometallurgical plant and scandium recovery circuit within sustaining capital, while mining, infrastructure, and tailings sustaining components remain broadly consistent across scenarios
Table 9: Capital Cost Summary
| Capital Cost Summary | Unit | Scenario A1 | Scenario A2 | Scenario B |
| Initial Capex | ||||
| Processing Plant (Excl. Hydrometallurgical Plant) | C$M | 1,609 | 1,645 | 1,810 |
| Mining CAPEX | C$M | 394 | 394 | 394 |
| Mining Pre-Stripping | C$M | 97 | 97 | 97 |
| Infrastructure (Power/Water/Roads/Camp)[14] | C$M | 326 | 326 | 326 |
| Tailings And Water Management | C$M | 157 | 157 | 157 |
| Indirects + EPCM | C$M | 258 | 262 | 278 |
| Contingency (25%) | C$M | 710 | 720 | 766 |
| Total initial CAPEX | C$M | 3,552 | 3,601 | 3,828 |
| Sustaining CAPEX | ||||
| Processing Plant (Inc. Hydrometallurgical Plant) | C$M | 285 | 285 | 1,194 |
| Mining CAPEX | C$M | 811 | 811 | 811 |
| Infrastructure (Power/Water/Roads/Camp) | C$M | 63 | 63 | 63 |
| Tailings and Water Management | C$M | 1,065 | 1,065 | 1,065 |
| Indirects + EPCM | C$M | 142 | 142 | 233 |
| Contingency (25%) | C$M | 390 | 390 | 640 |
| Total Sustaining CAPEX | C$M | 2,755 | 2,755 | 4,006 |
| Closure and Reclamation | C$M | 503 | 503 | 503 |
OPERATING COST SUMMARY
Table 10 summarizes the key operating cost and selling terms used in the PEA, reporting unit costs in C$/t moved, C$/t milled, and (where applicable) C$/kg of scandium oxide, together with concentrate transport and selling costs, TC/RC, and payability assumptions.
Average site operating costs are estimated at C$16.22/t milled for Scenario A (concentrate-only) and C$22.96/t milled for B, with the increase in B driven by the addition of hydrometallurgical processing and acid generation (C$3.09/t milled) and scandium oxide processing costs (C$939.55/kg Sc₂O₃).
On a payable metal basis, the study reports C1 cash costs of C$2.4/lb CuEq (A1), C$2.39/lb CuEq (A2), and C$2.89/lb CuEq (B) and AISC of C$2.79/lb CuEq (A1), C$2.78/lb CuEq (A2), and C$3.39/lb CuEq (B), reflecting the combined effects of recoveries, co-product/by-product credits, and the additional operating requirements of the full circuit.
Table 10: Operating Cost Summary[15]
| Operating Cost Summary | Units | Value |
| Average Mining Cost | C$/t-moved | 2.32 |
| Processing Cost – Up to Concentrate production (Scenario A) | C$/t-milled | 7.93 |
| Hydrometallurgical + Acid Generation (Scenario B) | C$/t-milled | 3.08 |
| Scandium Oxide processing (Scenario B) | C$/Kg Sc2O3 | 939.55 |
| G&A | C$/t-milled | 2.56 |
| Total Operating Cost | C$/t-milled | 22.96 |
| Cu-Au concentrate product | ||
| Transport and selling | C$/DMT | 95.90 |
| TC Cu-Au Concentrate | C$/DMT | 77.00 |
| Refining Cost- Cu | C$/lb | 0.11 |
| Refining Cost- Au | C$/oz | 6.85 |
| Refining Cost- Ag | C$/oz | 0.48 |
| Refining Cost- Co | C$/lb | 0.16 |
| Payable – Cu | % | 97 |
| Payable – Au | % | 95 |
| Payable – Ag | % | 90 |
| Payable – Co | % | 80 |
| Metal Production on-site (Scenario B) | ||
| Payable – Au | % | 97 |
| Payable – Ag | % | 97 |
| Payable – Co | % | 97 |
| C1 / cash cost (Scenario A1/A2/B) | US$/lb CuEq payable | 1.75 / 1.74 / 2.11 |
| AISC (Scenario A1/A2/B) | US$/lb CuEq payable | 2.04 / 2.03 / 2.47 |
ECONOMIC RESULTS
Table 11 summarizes the key economic assumptions and resulting financial metrics for Scenarios A1, A2, B, including the long-term price deck, cash flow generation, taxation, and discounted valuation at a 5% discount rate. Using an exchange rate of 1.37 CAD: 1.00 USD and long-term prices of US$4.88/lb Cu, US$3,272.60/oz Au, US$50.22/oz Ag, and US$19.57/lb Co (and US$1,500/kg Sc₂O₃ for B), the Project generates average annual EBITDA of C$886 million (A1), C$1,071 million (A2), and C$1,242 million (B). On a post-tax basis, NPV(5%) is estimated at C$4,963 million (A1), C$6,727 million (A2), and C$6,937 million (B) with corresponding post-tax IRRs of 19%, 23%, and 19%, and post-tax payback in Year 6 (A1), Year 5 (A2), and Year 7 (B). Total post-tax free cash flow is estimated at C$10,050 million (A1), C$12,961 million (A2), and C$14,763 million (B), reflecting the higher cash generation under the improved recovery case (A2) and the additional revenue streams in Scenario B, partially offset by the added capital and operating requirements of the hydrometallurgical and scandium circuits.
Table 11: Financial Metrics Consensus Metal Prices
| Metric | Unit | Scenario A1 | Scenario A2 | Scenario B |
| Financial Metrics | ||||
| Exchange Rate | CAD/USD | 1.37 | ||
| Long Term Copper Price | US$/lb | 4.88 | ||
| Long Term Gold Price | US$/oz | 3,272.60 | ||
| Long Term Silver Price | US$/oz | 50.22 | ||
| Long Term Cobalt Price | US$/lb | 19.57 | ||
| Long Term Scandium Oxide Price | US$/kg | N/A | 1,500 | |
| Average Annual EBITDA | C$M | 886 | 1,071 | 1,242 |
| Total EBITDA | C$M | 22,162 | 26,770 | 31,041 |
| Average Annual Free Cash Flow (Pre-tax) | C$M | 756 | 940 | 1,061 |
| Free Cash Flow (Pre-tax)[16] | C$M | 18,904 | 23,511 | 26,532 |
| Total Provincial Tax (Including BC Mineral Tax) | C$M | (4,029) | (5,090) | (5,772) |
| Total Federal Tax | C$M | (1,274) | (1,859) | (2,170) |
| Total Taxes | C$M | (5,303) | (6,949) | (7,942) |
| Average Annual Free Cash Flow (Post-tax) | C$M | 544 | 662 | 744 |
| Free Cash Flow (Post-tax)15 | C$M | 13,601 | 16,562 | 18,591 |
| Total Free Cash Flow (Pre-tax)[17] | C$M | 15,352 | 19,910 | 22,704 |
| Total Free Cash Flow (Post-tax)17 | C$M | 10,050 | 12,961 | 14,763 |
| NPV 5% (Pre-Tax) | C$M | 7,883 | 10,576 | 11,043 |
| NPV 5% (Pre-Tax) | US$M | 5,754 | 7,720 | 8,061 |
| IRR (Pre-Tax) | % | 24 | 29 | 23 |
| Payback (Pre-Tax) | years | Year 5 | Year 4 | Year 6 |
| NPV 5% (Post-Tax) | C$M | 4,963 | 6,727 | 6,937 |
| NPV 5% (Post-Tax) | US$M | 3,623 | 4,911 | 5,064 |
| IRR (Post-Tax) | % | 19 | 23 | 19 |
| Payback (Post-Tax) | years | Year 6 | Year 5 | Year 7 |
Table 12 summarizes the key economic assumptions and resulting financial metrics for A1, A2, B, using spot metal prices.
Table 12: Financial Metrics, Spot Metal Prices
| Metric | Unit | Scenario A1 | Scenario A2 | Scenario B |
| Financial Metrics | ||||
| Exchange Rate | CAD/USD | 1.37 | ||
| Long Term Copper Price | US$/lb | 6.00 | ||
| Long Term Gold Price | US$/oz | 5,200.00 | ||
| Long Term Silver Price | US$/oz | 90.00 | ||
| Long Term Cobalt Price | US$/lb | 25.54 | ||
| Long Term Scandium Oxide Price | US$/kg | N/A | 1,500 | |
| Average Annual EBITDA | C$M | 1,514 | 1,775 | 2,053 |
| Total EBITDA | C$M | 37,843 | 44,376 | 51,331 |
| Average Annual Free Cash Flow (Pre-Tax) | C$M | 1,383 | 1,645 | 1,873 |
| Free Cash Flow (Pre-Tax)16 | C$M | 34,585 | 41,118 | 46,822 |
| Total Provincial Tax (Includes BC Mineral Tax) | C$M | (7,657) | (9,163) | (10,484) |
| Total Federal Tax | C$M | (3,328) | (4,166) | (4,825) |
| Total Taxes | C$M | (10,985) | (13,329) | (15,309) |
| Average Annual Free Cash Flow (Post-Tax) | C$M | 944 | 1,112 | 1,261 |
| Free Cash Flow (Post-Tax)16 | C$M | 23,600 | 27,789 | 31,513 |
| Total Free Cash Flow (Pre-Tax)17 | C$M | 31,033 | 37,517 | 42,994 |
| Total Free Cash Flow (Post-Tax)17 | C$M | 20,048 | 24,188 | 27,685 |
| NPV 5% (Pre-Tax) | C$M | 17,230 | 21,073 | 22,734 |
| NPV 5% (Pre-Tax) | US$M | 12,577 | 15,382 | 16,594 |
| IRR (Pre-Tax) | % | 43 | 50 | 40 |
| Payback (Pre-Tax) | years | Year 3 | Year 3 | Year 3 |
| NPV 5% (Post-Tax) | C$M | 11,047 | 13,526 | 14,515 |
| NPV 5% (Post-Tax) | US$M | 8,064 | 9,873 | 10,595 |
| IRR (Post-Tax) | % | 34 | 39 | 32 |
| Payback (Post-Tax) | years | Year 3 | Year 3 | Year 4 |
SENSITIVITY ANALYSIS
Sensitivity cases were evaluated for the key value drivers using after-tax NPV (5%) and after-tax IRR, including ±20% copper and gold prices, +20% initial capital, +20% operating costs and, for B, a ±40% scandium price sensitivity.
Table 13: Sensitivity Summary (After-Tax NPV(5%) and IRR)
| Variable | Case (%) |
Metal Price | Scenario A1 | Scenario A2 | Scenario B | |||
| NPV (5%) (C$M) |
IRR (%) |
NPV (5%) (C$M) |
IRR (%) |
NPV (5%) (C$M) |
IRR (%) |
|||
| Base Case | Consensus forecast | 4,963 | 19 | 6,727 | 23 | 6,937 | 19 | |
| Copper Price | -20 | US$3.90/lb Cu | 3,218 | 15 | 4,807 | 19 | 5,094 | 15 |
| Copper Price | +20 | US$5.86/lb Cu | 6,688 | 23 | 8,632 | 28 | 8,764 | 22 |
| Gold Price | -20 | US$2,618.08/oz | 3,625 | 16 | 5,223 | 19 | 5,201 | 16 |
| Gold Price | +20 | US$3,927.12/oz | 6,289 | 22 | 8,222 | 27 | 8,661 | 22 |
| Metal Prices | -20 | All metal prices | 1,708 | 10 | 3,165 | 14 | 2,650 | 11 |
| Metal Prices | +20 | All metal prices | 8,118 | 27 | 10,233 | 32 | 11,110 | 26 |
| Initial CAPEX | +20 | Variable per Scenario | 4,448 | 16 | 6,222 | 19 | 6,394 | 16 |
| OPEX | +20 | Variable per Scenario | 3,660 | 16 | 5,438 | 20 | 5,185 | 16 |
| Scandium Oxide Price | -40 | US$900/kg Sc2O3 | 6,159 | 18 | ||||
| Scandium Oxide Price | +40 | US$2,100/kg Sc2O3 | 7,714 | 20 | ||||
Overall, the sensitivity analysis demonstrates that the Project’s after-tax economics remain positive across the tested ranges, with the greatest variability in after-tax NPV(5%) and IRR driven by simultaneous changes in the overall metal price deck. Changes to copper and gold prices individually have a meaningful but smaller effect, while +20% initial CAPEX and +20% OPEX reduce value but do not eliminate Project attractiveness in any of the evaluated scenarios. Scenario B shows additional exposure to scandium oxide price, with after-tax NPV(5%) varying within a narrower range relative to the broader multi-metal price cases, indicating that scandium provides incremental upside while the base-case Cu-Au Project remains financially robust on its own.
PERMITTING, RISKS, AND NEXT STEPS
Permitting and Environmental
Permitting Status
The permitting process will be supported by the continuation of environmental baseline studies, progression of engineering designs, and the initiation of socio-economic and cultural baseline studies.
Due to the anticipated rate of resource extraction, it is expected that the Hat Project will be subject to both federal and provincial impact assessment pathways, so submission to both the Impact Assessment Agency of Canada (IAAC) and British Columbia Environmental Assessment Office (B.C. EAO) for their review is currently anticipated. Agency determination will decide the appropriate level of agency collaboration under the existing cooperation agreement for the Hat Project to acquire a provincial Environmental Assessment Certificate (EAC) and/or federal Decision Statement.
The company will also submit a Joint Mines Act and Environmental Management Act Application through the B.C. Major Mines Office. Additional federal authorizations, including Fisheries Act approvals and compliance with Metal and Diamond Mines Effluent Regulations (MDMER), and applicable provincial permits will be obtained concurrently with other assessment and permitting steps. This will not only support protection of the immediate environment through the life of the Project but also respect the rights of First Nations and promote social and economic wellbeing for local communities.
Tailings and Water Management
The Tailings Storage Facility (TSF) includes a perimeter dyke primarily constructed from compacted cycloned sand. This material will be sourced from the coarse underflow of tailings processed through an on-site cyclone plant. Using the centreline raise method, the dam is designed to be free-draining, lowering the phreatic surface to facilitate geotechnical stability. During operations, seepage from the TSF will be directed to the process plant as reclaim water. Upon closure, the supernatant pond will be drained, and the tailings and dam surfaces will be reclaimed with a granular trafficability layer, followed by a growth medium and native revegetation.
The water management strategy prioritizes the reuse of site-impacted water, directing TSF water, contact water from the waste rock storage facilities, and open-pit dewatering to the process plant for use as make-up water.
Key Risks and Opportunities
Project-wide
Next Steps
About Doubleview Gold Corp.
Doubleview Gold Corp., a mineral resource exploration and development company based in Vancouver, British Columbia, Canada, is publicly traded on the TSX Venture Exchange [TSX-V: DBG], the OTCQB [DBLVF], the Berlin Stock Exchange [GER: A1W038], and the Frankfurt Stock Exchange [1D4]. Doubleview identifies, acquires, and finances precious and basemetal exploration projects in North America, particularly in British Columbia. The Company increases shareholder value through the acquisition and exploration of quality gold, copper, cobalt, scandium, and silver properties-collectively critical minerals-and through the application of advanced, state-of-the-art exploration methods. Doubleview’s portfolio of strategic properties provides diversification and mitigates investment risk.
About Mineit Consulting Inc.
Mineit Consulting Inc. (Mineit) is an independent mining engineering consulting company providing specialized expertise in project management, geological modelling, Mineral Resource estimation, mining engineering, metallurgical, and process engineering. Mineit lead and prepared the Hat Project MRE and PEA, with assistance from other engineering firms, for the Hat Project in accordance with the Canadian Institute of Mining, Metallurgy and Petroleum (CIM) Definition Standards on Mineral Resources and Reserves.
For further information please contact:
Doubleview Gold Corp
Vancouver, BC
Farshad Shirvani
President & CEO
Institutional Line: (604) 607-5470
T: (604) 678-9587
E: corporate@doubleview.ca
First Phosphate Corp. (CSE: PHOS) (OTCQX: FRSPF) (OTCQX ADR: FPH... READ MORE
Highlights: Hole NO-26-21a returned 11.37 m grading 4.92 g/t gold... READ MORE
Guanajuato Silver Company Ltd. (TSX-V:GSVR) (OTCQX:GSVRF) is pl... READ MORE
Falco Resources Ltd. (TSX-V:FPC) is pleased to announce the resul... READ MORE
TDG Gold Corp. (TSX-V: TDG) (OTCQX: TDGGF) is pleased to provide ... READ MORE


