


Gunnison Copper Corp. (TSX: GCU) (OTCQB: GCUMF) (FSE: 3XS0) is pleased to announce the results of an updated NI 43-101 Preliminary Economic Assessment on its 100%-owned Gunnison Copper Project in the Cochise Mining District, Arizona, United States. The PEA supersedes the previous PEA on the Gunnison Project released in December 2024 in all respects. All dollar amounts are in US dollars and “tons” refer to U.S. short tons (1 short ton equals approximately 0.91 metric tonnes or 2000 lbs).
Highlights:
| Copper Price Assumption: | $4.60/lb Cu Consensus | $5.75/lb Cu SPOT2 | |
| NPV8 (after-tax) | $M | 1,952 | 3,219 |
| IRR (after-tax) | % | 22.7% | 32.0% |
| Payback (after-tax) | #Years | 3.9 | 2.6 |
| Avg Annual Free Cash Flow (Y1-Y15) | $M | 366 | 514 |
The PEA is preliminary in nature and includes inferred mineral resources that are considered too speculative geologically to have the economic considerations applied to them that would enable them to be categorized as mineral reserves. There is no certainty that the conclusions reached in the PEA will be realized. Mineral resources that are not mineral reserves do not have demonstrated economic viability.
Dr. Stephen Twyerould, CEO, commented, “The updated PEA underscores the scale and compelling economics of the Gunnison Copper Project, positioning it as a significant future supplier to the American copper market and a key contributor to the domestic supply shortfall. At a consensus copper price of $4.60 per pound, the Project delivers an after-tax NPV8 of approximately US$2.0 billion, a 23% IRR, and an attractive 3.9 year payback, positioning Gunnison as one of the most financially compelling copper development projects in the United States. Importantly, 83% of the $692 million increase in NPV8% versus our 2024 preliminary economic assessment study is driven by operational enhancements within our control, including the addition of the high-grade Strong & Harris satellite deposit, material sorting, cement and limestone co-products, and optimization initiatives. With average annual production of 174 million pounds of 99.999% pure copper cathode in the first 15 years, lower-half-of-the-cost-curve operating metrics, and significant leverage to copper prices, we believe Gunnison offers shareholders meaningful exposure to a large-scale, long-life U.S. copper asset as we advance toward Pre-Feasibility, permitting, and project financing.”
Table 1: Key Valuation Metrics at $4.60/lb Copper Price Base Case
| Valuation Metrics (Unlevered) | Unit | 2026 PEA |
| Net Present Value @ 8% (after-tax) | $ millions | 1,952 |
| Net Present Value @ 10% (after-tax) | $ millions | 1,419 |
| Internal Rate of return (after-tax) | % | 22.7 |
| Payback Period | # years | 3.9 |
| EBITDA1 (annual average Y1-Y15) | $ millions | 488 |
| EBITDA1 (annual average Y1-Y21) | $ millions | 435 |
| Free Cash Flow1 (annual average Y1-Y15) | $ millions | 366 |
| Free Cash Flow1 (annual average Y1-Y21) | $ millions | 329 |
Table 2: Key Project Metrics
| Project Metrics | Unit | 2026 PEA |
| Construction Period | # months | 24 |
| Life of Mine | # years | 21 |
| Strip Ratio | Waste : Feed | 2.56 |
| Mineralized Material Mined | million tons | 641 |
| High Purity Limestone Mined | million tons | 133 |
| Alluvium-Gravel Waste Mined | million tons | 1,007 |
| Hard-Rock Waste Mined | million tons | 501 |
| Copper Grade of Material Placed on Leach Pad | % CuT | 0.43% |
| Annual Crusher Throughput (max) | million tons | 40 |
| Copper Recovery – Global | % CuT | 68.0% |
| Oxide / Enriched Recoveries | % CuTSol | 90.2% |
| Primary Sulfide Recoveries (years 10 to 21) | % CuSu | 59.9% |
| Recovered Copper Cathode | million lbs | 3,187 |
| Average Annual Copper Production (years 1-15) | million lbs 000’s tons |
174 87 |
| Initial Capital (including contingency) | $ millions | 1,544 |
| Initial Capital Excluding Acid Plant | $ millions | 1,261 |
| Capital Intensity Excluding Acid Plant1 | $/ton Cu Capacity | 14,278 |
| Profitability Ratio | NPV8% / Initial Capex | 1.3 |
| Expansion Capital (including contingency)2 | $ millions | 682 |
| Sustaining Capital3 | $ millions | 613 |
| Cash Cost (C1)4 | $/lb Cu | 1.69 |
| Sustaining Cash Cost5 | $/lb Cu | 2.00 |
| All-In Sustaining Cash Cost6 | $/lb Cu | 2.06 |
The PEA was completed by M3 Engineering & Technology Corporation of Tucson, AZ and is effective as of February 22, 2026. The Technical Report summarizing the results of the PEA and prepared in accordance with National Instrument 43-101, will be filed on SEDAR+ and GCC’s website within 45 days of this news release.
Updated Preliminary Economic Assessment Summary
The Project is in Cochise County, Arizona, approximately 65 miles east of Tucson and is held or controlled 100% by GCC. GCC has a successful track record of permitting and community relations. This, along with the fact that the Gunnison open pit has no federal permitting nexus, on flat ground with no identified endangered or threatened species or habitat, and no historical, archaeological, or Native American artefacts identified in prior studies, indicates the Company’s prior permitting track record can be maintained.
Key Changes Versus the 2024 PEA
Key changes versus the 2024 PEA include various price deck changes beyond the control of management, such as the change in long-term copper price and various operating and capital cost escalation from 2024 to 2026, as well as non-price deck changes, including improvements such as mining the high-grade Strong & Harris satellite deposit.
Net Present Value at 8.00% discount rate is the selected metric to explain the changes since the previous PEA as this metric best captures the total economic return to the Company of the Gunnison Project.
Refer to the chart and text below for explanations of the change in valuation versus the 2024 PEA.

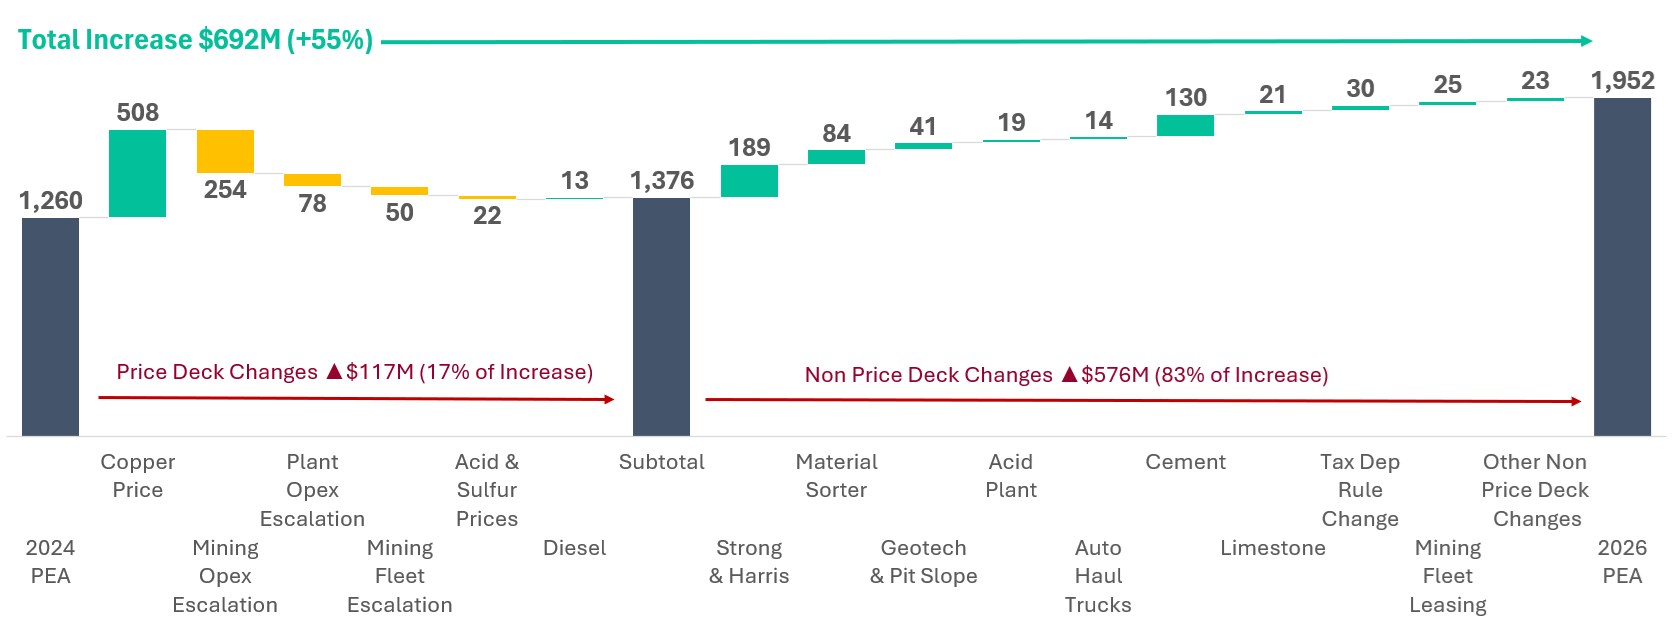
Chart 1: Change in Net Present Value 8.00% (NPV8%) – 2026 PEA versus 2024 PEA ($M)
To view an enhanced version of this graphic, please visit:
https://images.newsfilecorp.com/files/2744/285349_efb2444044252ba4_002full.jpg
Note: NPV8% variance bars should be considered approximations and include an element of estimation and interpretation. Cross correlations between variable changes may not be fully captured in each bar due to the sequence of applying changes in the financial model and other supplementary calculations performed for variables not directly changeable in the financial model.
The 2026 PEA NPV8% of $1,952M is an increase of $692M (+55%) from the 2024 PEA NPV8% of $1,260M. The increase is comprised of Price Deck changes of $117M, 17% of the increase, and Non-Price Deck changes of $576M, the remaining 83% of the increase. The following explains the key changes in more detail:
Price Deck Changes $117M – The main driver is the increase in long-term consensus copper price from $4.10/lb in the 2024 study to $4.60/lb in the 2026 study. Management uses analyst consensus given the extensive knowledge and expertise of the institutions involved and the overall reliance of the market and investors on consensus pricing. Acid, Sulfur, and Diesel prices were calculated on a delivered basis to site based on data purchased from leading industry consultants, actual delivered to site pricing, and direct discussions with logistics and commodity producers in the region. Mining opex, plant opex, and mining fleet escalation is based on inflation and other factors to escalate pricing from 2024 to 2026 real dollars and includes direct quotes from equipment manufacturers and service providers. Mining opex escalation also includes the impact of mining additional more costly blocks, due primarily to increased stripping requirements, from the bigger Gunnison main pit shell that the higher copper price makes economic to mine versus the smaller pit shell in the 2024 study.
Strong & Harris Satellite Deposit $189M – This satellite deposit, located only 1.9 miles from the processing plant, adds over 25 Mtons of high-grade material to the leach pad at 0.85% total copper grade to the processing plan over three years (Y11-Y13). Given the mining fleet and plant costs are fully supported already by the Gunnison Open Pit economics, the addition of the Strong & Harris material results in a significant NPV8% increase, extension of mine life, and increase in the leach pad head grade. No credits for zinc or silver are included in the new Strong and Harris mine and processing plan but could be considered an opportunity for later with additional processing infrastructure. As Strong & Harris is now included within the PEA, the prior technical report filed on SEDAR+ at www.sedarplus.ca entitled: “Estimated Mineral Resources and Preliminary Economic Analysis, Strong and Harris Copper-Zinc-Silver Project, Cochise County, Arizona” dated effective of September 9, 2021 has been superseded and is no longer a current technical report.
Material Sorter $84M – The mineralized Material Sorting equipment uses optical sensors to detect non-mineralized material amongst the crushed material prior to stacking on the leach pad and diverts it to waste. This reduces significantly the inclusion of non-mineralized material on the leach pad, thereby increasing the leached head grade and reducing acid consumption. In total, 97.7 Mtons of oxide material and 3.1Mtons of sulfide material is sorted to the waste stream over the life of mine, reducing mineralized material stacked and leached from 641.5 Mtons mined to 540.7 Mtons leached. The direct costs in initial capital for the equipment is $205.4M and the operating costs are $0.86/ton of mineralized material sorted and leached. Only the Martin and similar formations are included in the Material Sorting profile.
Geotechnical & Pit Slope $41M – Samples were collected in 2025 of the alluvium/conglomerate overburden at Gunnison as part of the HVA program. Their strength and geotechnical characters were analyzed and interpreted resulting in steeper pit walls than the previous study in 2024. In the alluvial overburden in 2024 the pit wall angles were determined to be 42 degrees, however the weakly cemented conglomerate component was determined to range from 45 to 49 degrees increasing in steepness with depth.
Acid Plant $19M – Due to reductions in total acid consumption in the 2026 PEA versus the 2024 PEA, the acid plant capacity was reduced by 10%, from 3,000 to 2,700 tons per day of acid production, along with other beneficial design modifications resulted in savings of $73M in initial capex. A decrease in profit per unit on third party acid sales partially offsets this improvement, due to higher operating costs.
Autonomous Haul Trucks $14M – Autonomous Haulage Systems have become an accepted mining tool for modern mines. The effect of lowering operating costs is greater than the additional capital required for AHS. The trucks last longer, require less maintenance and are more efficient in delivering expected production rates.
Cement $130M and Limestone $21M Coproducts – In 2025, drilling and lab testing confirmed the limestone overburden on top of the Gunnison Pit to be a very high purity limestone suitable for producing several saleable products. Based on the specifications of the limestone determined by the lab testing, and market studies conducted by third party consultant firm Burgex, it was determined the highest and best use of the limestone is to process it into cement for sale into local and regional markets up to the annual amount the market is in deficit. Local market studies indicate a current deficit of over 1M tons of cement that is currently filled by foreign Mexican production with high freight costs and tariffs. As a result, a cement plant can be constructed with an output capacity of 1M tons of cement per year at an initial capital cost of $326M and it will sell cement for $157.21/ton. The plant will be constructed in Years 4 and 5 after full payback on initial capex has been reached and cumulative free cash flow is sufficient to pay for the cement plant capex. The rail facility included in the capex has a dedicated outbound capacity of 3M tons per year. Given 1M tons of cement will be sold per year, 2M tons of unrefined high grade limestone will also be sold to third parties at a price of $4.80/ton. The overall limestone overburden, at 133M tons, is a very large and special discovery and will continue to operate post Y21, the final year of copper production, until the resource is completely depleted in Y70. Opportunity exists for future expansion of the cement plant.
Tax Depreciation Rule Changes $30M – The One Big Beautiful Bill Act of 2025 permanently extended the Bonus Depreciation tax rule that permits 100% deduction of tangible property with a recovery period of 20 years or less, and other qualified improvement property, in the year of expenditure. This accelerated depreciation reduces cash income taxes paid in the earlier years of the project, improving NPV8%. The same total cash taxes are paid over the life of the mine but now are been paid later due to the accelerated deductions.
Mining Fleet Leasing $23M – The initial mining fleet is now assumed to be capital leased with interest only payments during the construction period that increases the NPV, partially offset by a 125 bps higher lease rate premium included in the lease for this feature. Mining fleet purchases included in sustaining capex are now also assumed to be leased with regular payment terms.
Other Non-Price Deck Changes $23M – All other changes
Financial Analysis
The PEA base case generates an after-tax Net Present Value of approximately $2.0 billion (at a discount rate of 8%) and an Internal Rate of Return (IRR) of 22.7%. This financial analysis is based on a non-levered cash flow model, revenues and costs priced in 2026 real US dollars, mid period discounting, and a valuation date set at the start of Project construction. The following tables detail key financial model inputs.
Table 3: Price Deck
| Price Deck Inputs | Unit | 2026 PEA |
| Copper Price | $/lb | 4.60 |
| Net Copper Premium | $/lb | 0.04 |
| Molten Sulfur Delivered – Purchases | $/ton | 160.00 |
| Sulfuric Acid Delivered – Purchases | $/ton | 210.00 |
| Sulfuric Acid Delivered – Sales | $/ton | 190.00 |
| Diesel Delivered | $/gallon | 2.96 |
| Propane Delivered | $/gallon | 2.00 |
| Cement – Sales | $/ton | 157.21 |
| Limestone – Sales | $/ton | 4.80 |
| Power – Purchases & Sales | $/kWh | 0.079 |
Price Deck Notes:
Table 4: Capital Expenditures
The capital cost estimates for this PEA, shown in table below, were developed with a -25% to +30% accuracy. The Company has used an overall contingency of 20% in accordance with Association of the Advancement of Cost Engineering International (AACE) Class 5 estimate guidelines.
| Capital Expenditures Inputs | Unit | Initial | Expansion | Sustaining |
| Direct Costs – Mine Costs | $ million | 294.0 | – | 77.7 |
| Direct Costs – Deferred Stripping | $ million | – | 185.7 | |
| Direct Costs – Leach Pad | $ million | 76.1 | 201.2 | – |
| Direct Costs – Crusher | $ million | 53.3 | – | – |
| Direct Costs – Ore Sorting | $ million | 205.4 | – | – |
| Direct Costs – SX-EX | $ million | 186.0 | – | – |
| Direct Costs – Freight | $ million | 52.4 | 16.0 | – |
| Direct Costs – Subtotal | $ million | 867.0 | 217.3 | 263.4 |
| Indirect Costs | $ million | 148.0 | 32.9 | – |
| Owner’s Costs | $ million | 65.6 | – | – |
| Contingency | $ million | 127.5 | 39.2 | |
| Subtotal | $ million | 1,208.1 | 289.4 | 263.4 |
| Acid Plant | $ million | 282.3 | – | – |
| Infrastructure | $ million | 53.2 | 10.8 | – |
| Sulfide Plant | $ million | – | 56.6 | – |
| Cement Plant | $ million | – | 325.5 | 349.5 |
| Total CAPEX | $ million | 1,543.7 | 682.3 | 612.9 |
Capital Expenditures Notes:
Table 5: Operating Expenditures – Copper
| Operating Expenditures – Copper Inputs | $ Millions Total | $/lb Cu Produced | $/Ton | |
| Mining – Before Deferred Stripping | 4,179 | 1.31 | $/ton mined $/ton mined $/ton mined |
1.83 |
| Mining – Limestone Credits | (231) | (0.07) | (0.10) | |
| Mining – Deferred Stripping | (186) | (0.06) | (0.08) | |
| Mining – Subtotal | 3,762 | 1.18 | $/ton mined | 1.65 |
| Processing – Heap Leach | 1,146 | 0.36 | $/ton leached | 2.12 |
| Processing – Material Sorting | 218 | 0.07 | $/ton sorted | 0.86 |
| Processing – SX/EW | 636 | 0.20 | $/ton leached | 1.18 |
| Processing – Subtotal | 2,000 | 0.63 | $/ton leached | 3.70 |
| G&A – Onsite | 142 | 0.04 | $/ton mined | 0.22 |
| G&A – Limestone Credits | (6) | (0.00) | $/ton mined | (0.01) |
| Byproduct Credits – Acid Sales | (503) | (0.16) | $/ton mined | (0.78) |
| Cash Cost (C1) | 5,396 | 1.69 | $/ton mined | 8.41 |
| Sustaining Capex – Mining | 78 | 0.02 | $/ton mined | 0.12 |
| Sustaining Capex – Deferred Stripping | 186 | 0.06 | $/ton mined | 0.29 |
| Sustaining Capex – Subtotal | 263 | 0.08 | $/ton mined | 0.41 |
| Royalties | 715 | 0.22 | $/ton mined | 1.11 |
| Sustaining Cash Cost | 6,374 | 2.00 | $/ton mined | 9.94 |
| Taxes – Property Tax | 64 | 0.02 | $/ton mined | 0.10 |
| Taxes – Severance Tax | 109 | 0.03 | $/ton mined | 0.17 |
| Taxes – Subtotal | 173 | 0.05 | $/ton mined | 0.27 |
| Closure – Reclamation (Inc. Surety Bond) | 72 | 0.02 | $/ton mined | 0.11 |
| Closure – Salvage Value | (63) | (0.02) | $/ton mined | (0.10) |
| Closure – Subtotal | 9 | 0.00 | $/ton mined | 0.01 |
| All-In Sustaining Cost (AISC) | 6,556 | 2.06 | $/ton mined | 10.22 |
Operating Expenditures – Copper Notes:
Table 6: Operating Expenditures – Cement
| Operating Expenditures -Cement Inputs | $ Millions Total |
$/Ton Limestone Processed |
$/Ton Cement Produced |
| Mining | 231 | 2.89 | 3.53 |
| Processing – Raw Materials Processing | 612 | 7.69 | 9.38 |
| Processing – Additives | 768 | 9.64 | 11.76 |
| Processing – Energy | 1,536 | 19.28 | 23.52 |
| Processing – Labor & Staff | 718 | 9.01 | 10.99 |
| Processing – Maintenance | 811 | 10.18 | 12.42 |
| Processing – Other Costs | 693 | 8.70 | 10.61 |
| Processing – Subtotal | 5,137 | 64.49 | 78.68 |
| Freight | 845 | 10.61 | 12.95 |
| G&A – Onsite | 408 | 5.12 | 6.25 |
| G&A – Mining – Portion out of Cu | 6 | 0.07 | 0.09 |
| Byproduct Credits – Limestone – Royalty Sales | (255) | (3.20) | (3.90) |
| Cash Cost (C1) | 6,372 | 79.99 | 97.59 |
| Sustaining Capex | 350 | 4.39 | 5.35 |
| Sustaining Cash Cost | 6,722 | 84.38 | 102.95 |
| Taxes – Property Tax | 34 | 0.43 | 0.52 |
| Closure – Reclamation (Inc. Security Bonds) | 59 | 0.74 | 0.90 |
| Closure – Salvage Value | (26) | (0.33) | (0.40) |
| Closure – Subtotal | 33 | 0.41 | 0.50 |
| All-In Sustaining Cost (AISC) | 6,789 | 85.22 | 103.97 |
Operating Expenditures – Cement Notes:
Table 7: Other Financial Inputs
| Financial Inputs | Unit | 2026 PEA |
| Royalties | % | 4.50 |
| Stream Royalty Equivalent | % | 2.12 |
| State Royalty Equivalent | % | 0.50 |
| Federal Income Tax Rate | % | 21.00 |
| State Income Tax Rate | % | 4.90 |
| Net Operating Loss Opening Balance | $ millions | 106.8 |
| Bonus Depreciation | % | 100.0 |
| Working Capital Turnover – Accounts Receivable | # days | 15.0 |
| Working Capital Turnover – Accounts Payable | # days | 55.0 |
| Working Capital Turnover – Supplies | # days | 25.0 |
| Equipment Lease – Initial Fleet – Interest Rate | % | 8.48 |
| Equipment Lease – Initial Fleet – Downpayment | % | 15.0 |
| Equipment Lease – Initial Fleet – Term | # years | 7.0 |
| Closure Costs – Surety Bonds Premium | % | 1.0 |
Other Financial Inputs Notes:
Table 8: Profitability Metrics – Copper
| Profitability Metrics – Copper | $ Millions Total | $/Ton Processed | $/lb Cu Produced |
| Gross Revenues 1 | 14, 485 | 26.79 | 4.54 |
| Royalties | (715) | (1.32) | (0.22) |
| Net Revenue | 13,769 | 25.47 | 4.32 |
| Cash Cost (C1) – Copper | (5,396) | (9.98) | (1.69) |
| EBITDA | 8,374 | 15.49 | 2.63 |
| Depreciation | (2,814) | (5.20) | (0.88) |
| EBIT | 5,559 | 10.28 | 1.74 |
| Taxes | (1,145) | (2.12) | (0.36) |
| Closure | (9) | (0.02) | (0.00) |
| Net Earnings | 4,406 | 8.15 | 1.38 |
| Add Back Depreciation | 2,814 | 5.20 | 0.88 |
| Sustaining Capex | (263) | (0.49) | (0.08) |
| Free Cash Flow | 6,957 | 12.87 | 2.18 |
This table contains Non-IFRS financial measures; see “Non-IFRS Financial Measures”.
1 Gross Revenues includes the effects of the Triple Flag stream
Profitability Metrics – Copper Notes:
Table 9: Profitability Metrics – Cement
| Profitability Metrics – Cement | $ Millions Total |
$/Ton Limestone Processed |
$/ton Cement Produced |
| Revenues – Cement | 10,265 | 128.86 | 157.21 |
| Revenues – Limestone | 255 | 3.20 | 3.90 |
| Net Revenue | 10,520 | 132.06 | 161.11 |
| Cash Cost (C1) | (6,372) | (79.99) | (97.59) |
| EBITDA | 4,147 | 52.07 | 63.52 |
| Depreciation | (675) | (8.47) | (10.34) |
| EBIT | 3,472 | 43.59 | 53.18 |
| Taxes | (777) | (9.75) | (11.89) |
| Closure (Net of Salvage Value) | (33) | (0.41) | (0.50) |
| Net Earnings | 2,663 | 33.43 | 40.79 |
| Add Back Depreciation | 675 | 8.47 | 10.34 |
| Sustaining Capex | (350) | (4.39) | (5.35) |
| Free Cash Flow | 2,989 | 37.52 | 45.77 |
Next page is Financial Model Key Inputs by Year
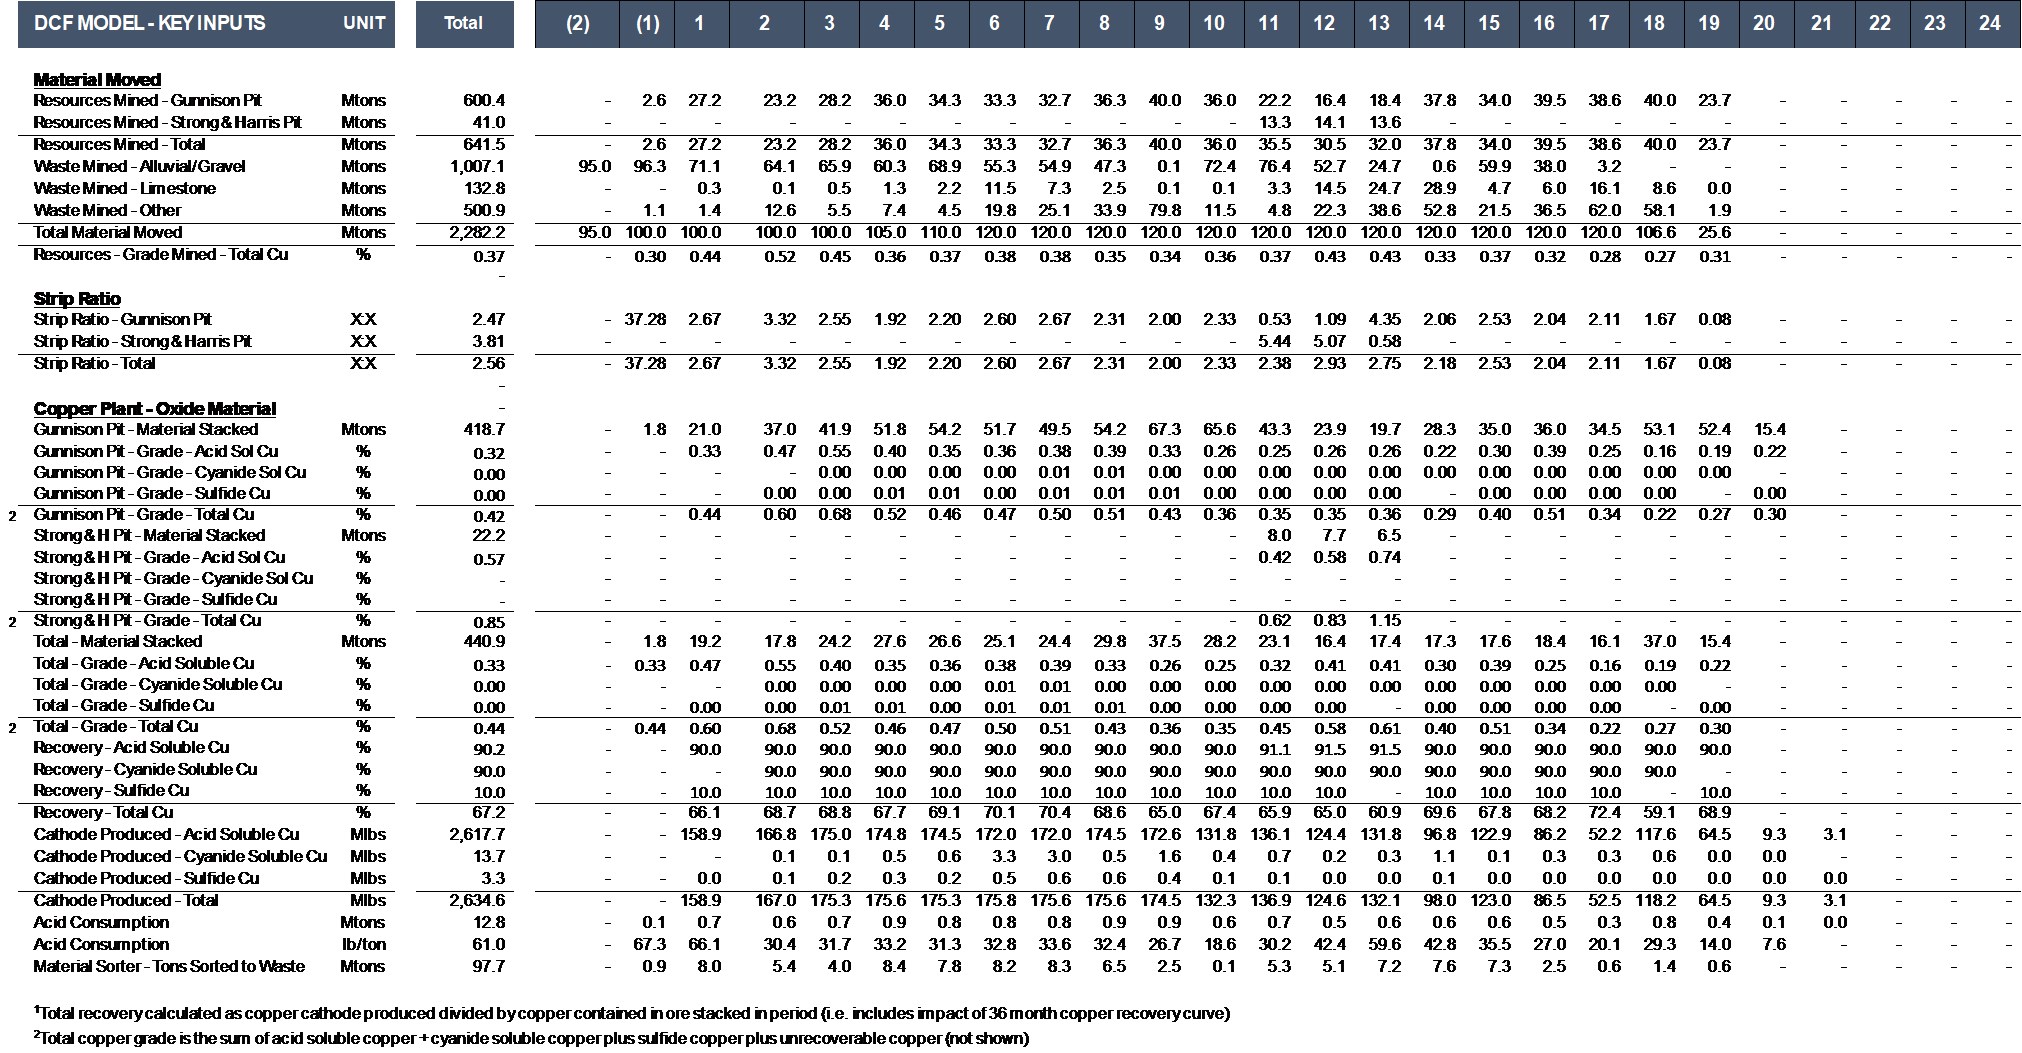
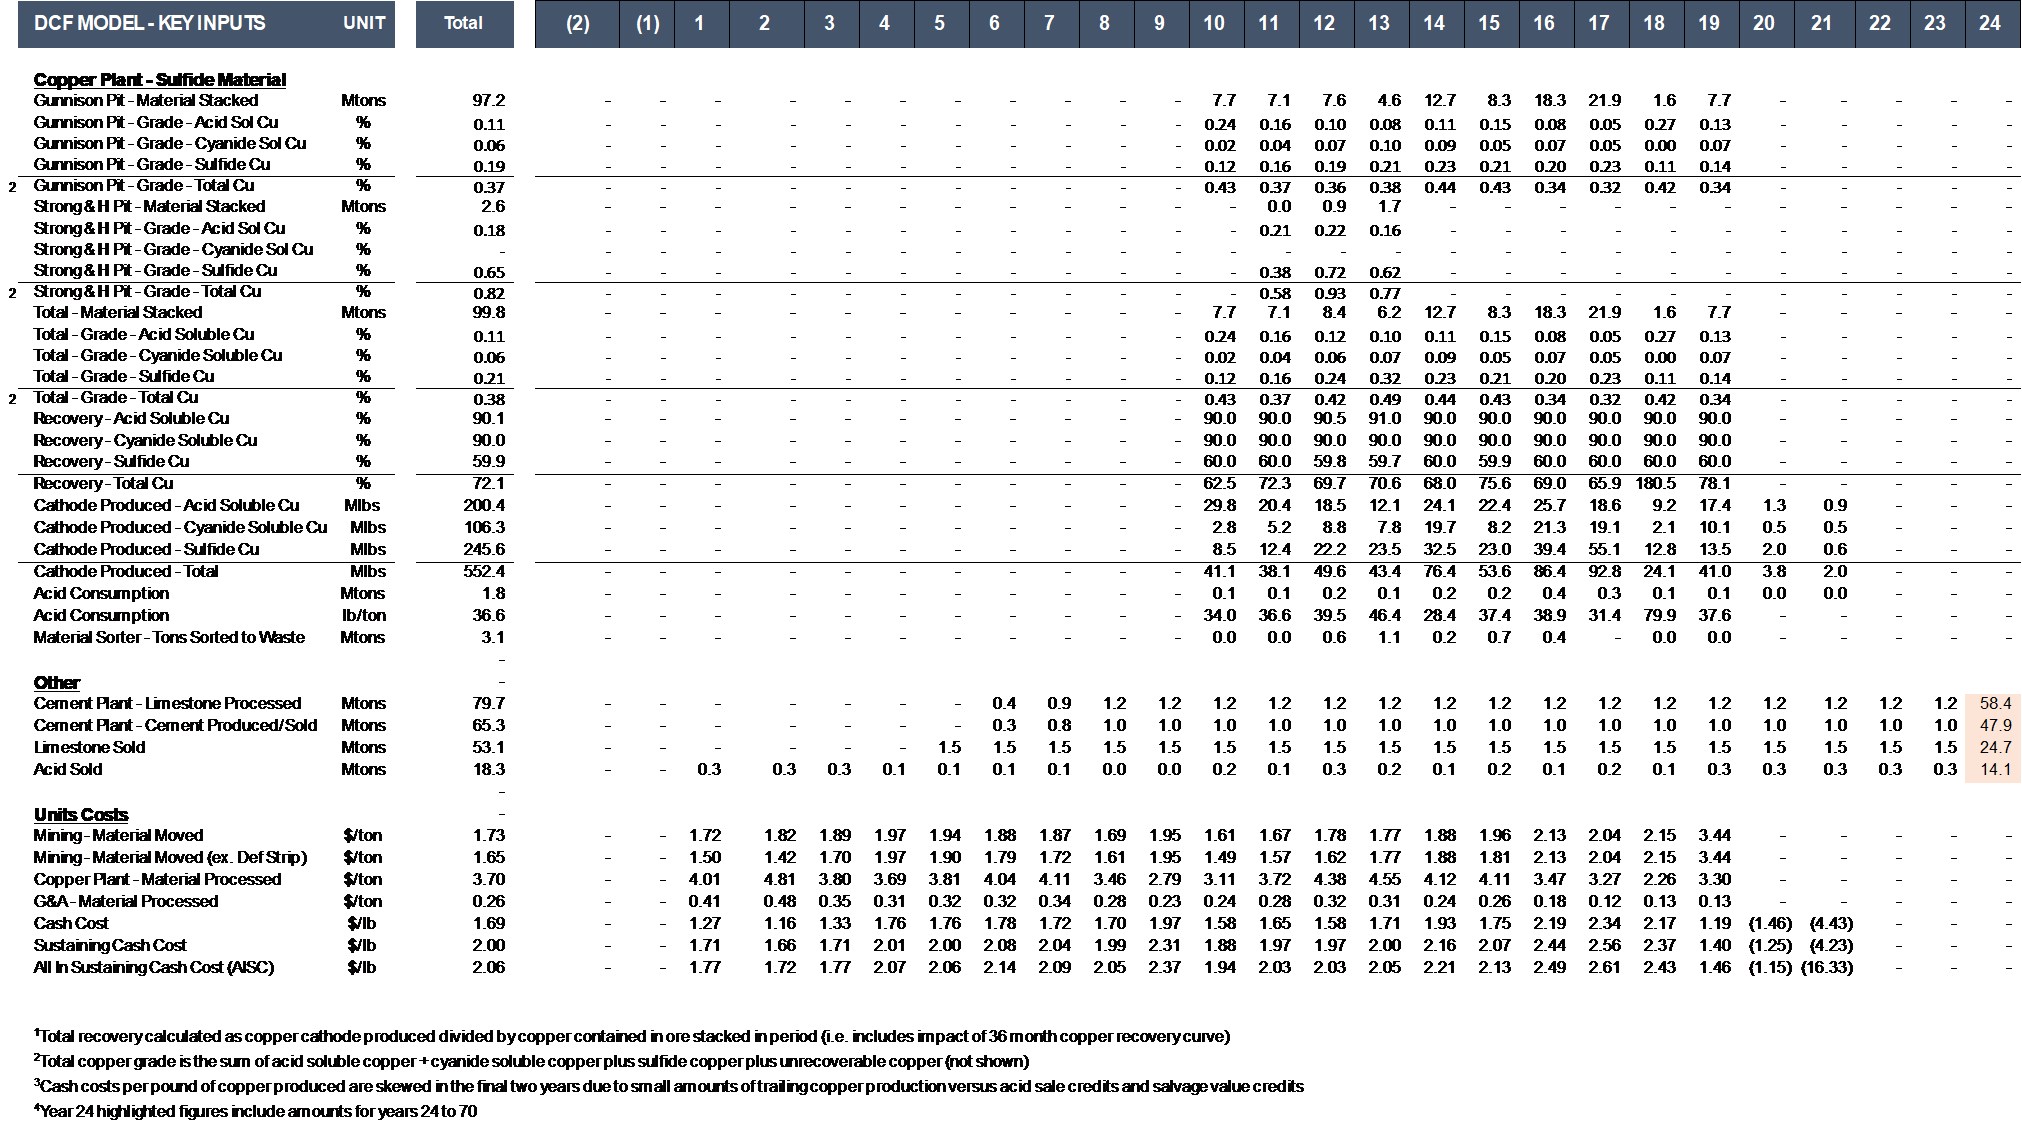
Financial Model – Key Inputs
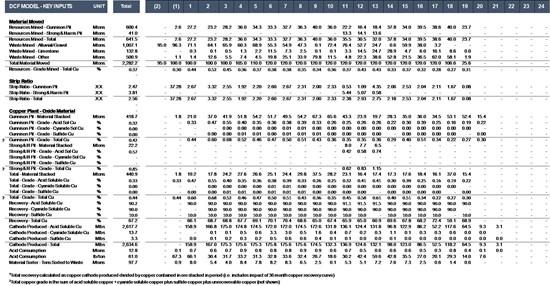
To view an enhanced version of this graphic, please click on the image or visit:
https://images.newsfilecorp.com/files/2744/285349_efb2444044252ba4_003full.jpg
Financial Model – Key Inputs
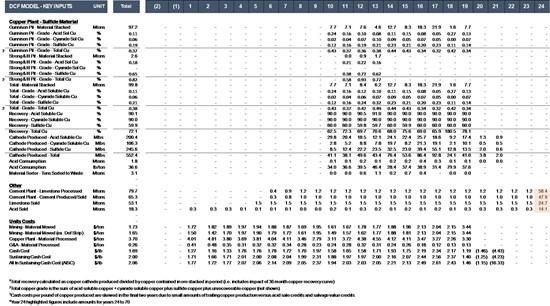
To view an enhanced version of this graphic, please click on the image or visit:
https://images.newsfilecorp.com/files/2744/285349_efb2444044252ba4_004full.jpg
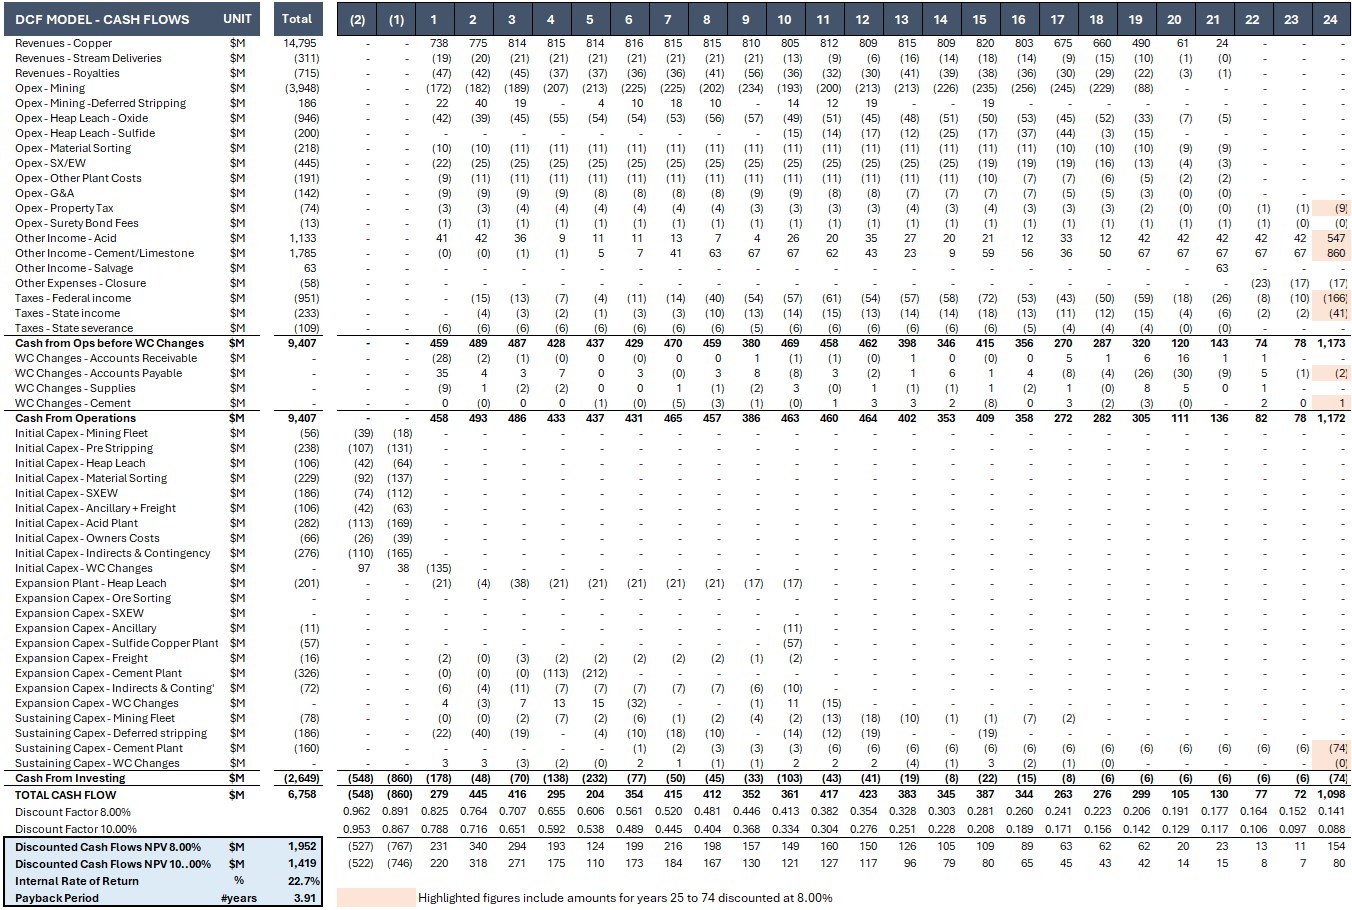
Financial Model – Cash Flows by Year
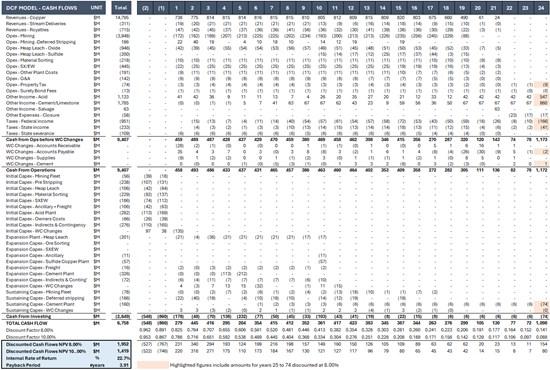
To view an enhanced version of this graphic, please click on the image and visit:
https://images.newsfilecorp.com/files/2744/285349_efb2444044252ba4_005full.jpg
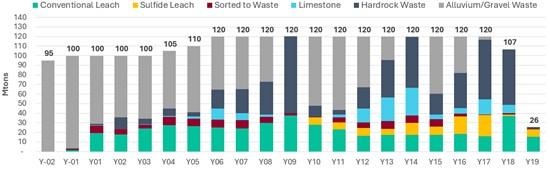
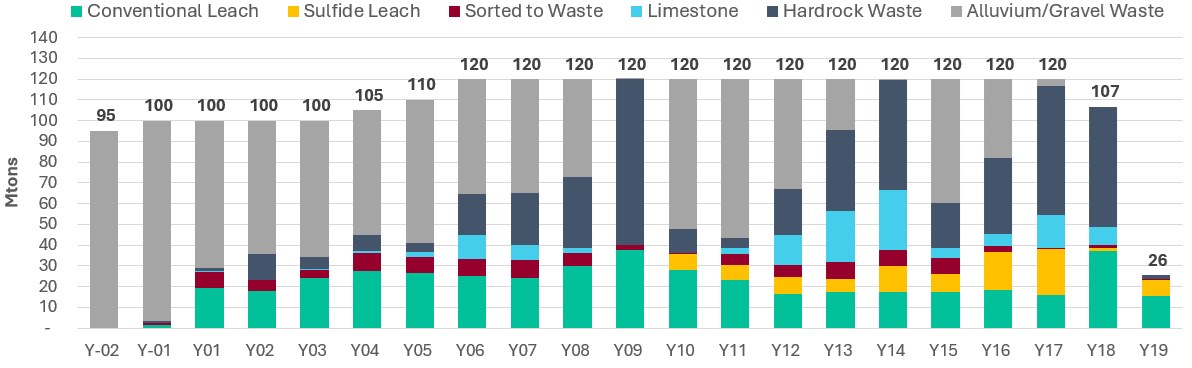
Mine Plan and Production Profile (Mtons)
To view an enhanced version of this graphic, please visit:
https://images.newsfilecorp.com/files/2744/285349_efb2444044252ba4_006full.jpg
Note: Leach numbers correspond to the tons stacking in the leach pads per year, and do not necessarily indicate copper recovery in those periods.
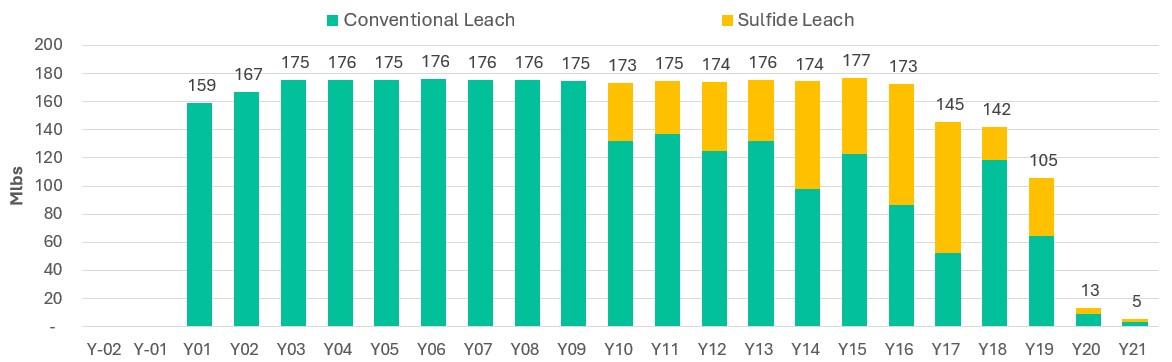
Copper Cathode Produced (Mlbs)

To view an enhanced version of this graphic, please visit:
https://images.newsfilecorp.com/files/2744/285349_efb2444044252ba4_007full.jpg
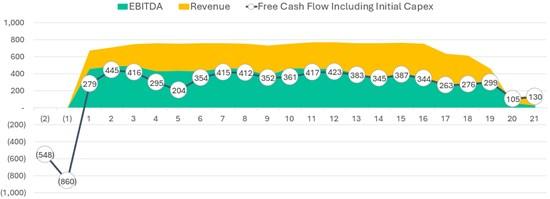
Free Cash Flow Profile ($M)
To view an enhanced version of this graphic, please visit:
https://images.newsfilecorp.com/files/2744/285349_efb2444044252ba4_008full.jpg
Years 4 and 5 free cash flows include the impact of $326M in expansion capital for the cement plant.
Mineral Resource Estimate
The mineral resource estimate for the Gunnison deposit is based on results from 122 drill holes totalling 158,785 feet and is effective as of January 23, 2026. Gunnison deposit mineral resources are classified in order of increasing geological confidence into Inferred, Indicated, and Measured categories in accordance with the “CIM Definition Standards – For Mineral Resources and Mineral Reserves” and therefore NI 43-101. GCC is not aware of any environmental, permitting, legal, title, taxation, socio-political, marketing or other issues which may materially affect its estimate of mineral resources.
The Gunnison deposit mineral resources are reported within an optimized pit at cut-offs that are reasonable given anticipated open-pit mining methods, processing costs, and economic conditions, which fulfills regulatory requirements that a mineral resource exists in such form, grade or quality and quantity that there are reasonable prospects for eventual economic extraction.
The pit-constrained mineral resources are tabulated using an internal cut-off grade of 0.05% TCu for oxide and transition, and 0.1% TCu for sulfide. No mineral resources were estimated within overburden (Tertiary/Quaternary alluvium), and the reported mineral resources are restricted to lands controlled by GCC.
| Total Resources – Gunnison Deposit | |||
| Resource Class | Short Tons (millions) |
Total Cu (%) |
Cu Pounds (millions) |
| Measured | 191.5 | 0.37 | 1,423 |
| Indicated | 654.5 | 0.31 | 3,768 |
| Measured + Indicated | 846.1 | 0.33 | 5,190 |
| Inferred | 94 | 0.21 | 397 |
The Gunnison mineral resources were modeled to reflect the detailed lithologic, structural, and oxidation modeling completed by GCC. Copper mineral domains guided by these geological controls, were interpreted on east-west vertical cross sections on 100-foot spacing, which encompass the 2.3-mile north-south and 1.3-mile east-west extents of the deposit. These domains were then used to explicitly constrain the estimation of copper grades into 50 x 100 x 25-foot (x, y, z) model blocks using 20-foot composites and inverse-distance interpolation. The grade estimation is further controlled by the incorporation of search ellipses that reflect the orientations of modeled structural zones, as well as those of favorable stratigraphic units in areas unaffected by the structures. Sequential copper assay ratios were used to define three-dimensional surfaces separating the Oxide, Transitional, and Sulfide zones of the mineralization.
All samples were prepared from manually split half-core sections on-site in Arizona. Split drill core samples were then sent to Skyline Assayers & Laboratories (“Skyline”) in Tucson, Arizona, an independent laboratory, for Total Copper (TCu) and Sequential Copper analyses, Acid Soluble Copper (ASCU) and Cyanide Soluble Cu (CNCu). Skyline is accredited with international standard ISO/IEC 17025:2005 General Requirements for the Competence of Testing and Calibration Laboratories. Analytical results for (TCu), (ASCu), and (CNCu) were reported. GCC has no relationship with Skyline Labs other than Skyline being a service provider. Standards, blanks, and duplicate assays are included at regular intervals in each sample batch submitted from the field as part of an ongoing Quality Assurance/Quality Control Program.
The mineral resource estimate for the Strong and Harris deposit is underpinned by 152 historical drillholes totaling 130,679 feet and is effective as of January 23, 2026. Strong and Harris deposit mineral resources are classified in order of increasing geological confidence into Inferred, Indicated, and Measured categories in accordance with the “CIM Definition Standards – For Mineral Resources and Mineral Reserves” and therefore NI 43-101. GCC is not aware of any environmental, permitting, legal, title, taxation, socio-political, marketing or other issues which may materially affect its estimate of mineral resources.
The pit-constrained mineral resources for Strong and Harris are tabulated using an internal cut-off grade of 0.07% TCu within optimized pit shells. No mineral resources were estimated within overburden (Tertiary/Quaternary alluvium), and the reported mineral resources are restricted to lands controlled by GCC.
| Total Resources – Strong & Harris Deposit | |||||||
| Resource Class |
Short Tons (millions) |
Total Cu (%) |
% Zn | Oz Ag/ton | Cu Pounds (millions) |
Zn Pounds (millions) |
Oz Ag (millions) |
| Inferred | 76 | 0.49 | 0.56 | 0.12 | 740 | 856 | 9 |
Notes:
The Strong and Harris mineral resources were modeled to reflect the detailed geologic and structural controls on mineralization. Copper, zinc, and silver mineral domains guided by these geological controls, were interpreted on 200-foot spacing along the approximate direction of dip (045° azimuth). While each metal was explicitly interpreted on every cross section, copper, zinc, and silver are generally spatially coincident throughout the deposit. These domains were then used to explicitly constrain the estimation of copper, zinc, and silver grades into 20 x 20 x 20-foot (x, y, z) model blocks using 10-foot composites and inverse-distance interpolation. The grade estimation is further controlled by the incorporation of search ellipses that reflect the orientations of modeled structural zones, as well as those of favorable stratigraphic units in areas unaffected by the structures. Sequential copper assay ratios were used to define three-dimensional surfaces separating the Oxide, Transitional, and Sulfide zones of the mineralization. The block model covers 3.91 square miles and extends to a maximum depth of 2,820 feet below the topographic surface.
Mr. Jeffrey Bickel, C.P.G., with the independent firm RESPEC Company LLC of Reno, Nevada, is a Qualified Person as defined by NI 43-101 and is responsible for this mineral resource estimate. He has verified, reviewed, and approved the technical disclosure contained in this section of the news release. Mr. Bickel has verified the data underlying the results by reviewing the drilling, sampling, assay, and quality assurance and quality control data, as well as the geologic interpretations completed by GCC. Mineral resources that are not mineral reserves do not have demonstrated economic viability.
Risks
Certain risks and opportunities are associated with the Project, as is typical for mine development projects. These risks may include and are not limited to environmental permitting, title issues, taxation, public/political opposition, or legal impediments to operating this type of mining/processing operation at this location. The following Project-specific risks have been identified along with the measures that GCC envisages to mitigate the risk.
Opportunities
Several opportunities have been identified which could enhance the viability and economic attractiveness of the Open Pit Project. Many of these opportunities may be realized by removal of risk and uncertainty that are present at the PEA level.
Recommendations
Based on the results of this PEA, it is recommended that GCC consider proceeding with a PFS of the open pit project which is expected to take approximately 18 months. A feasibility study will be proposed on successful completion of the PFS.
Additional drilling for resource verification and geotechnical coverage is recommended to support mine planning. Updating the acid plant design for the selected capacity is also recommended. Additional planning and costing work are required to establish the schedule and costs for the relocation of Interstate 10 and the addition of the rail spur to the Union Pacific Railroad.
Additional drilling will be required for metallurgical studies. Pilot metallurgical heap leach testing is recommended to investigate the recovery kinetics and flow characteristics for the heap leach design. In addition, mineralized material sorting studies are recommended to determine the effectiveness and economics.
A mine plan, heap leach design, SX-EW design and highway move design are necessary to complete the PFS.
GCC has proposed a list and budget for additional work that will support a Prefeasibility Study.
| Prefeasibility Study Budget for the Gunnison Project | ||||
| Detail | Gunnison | Strong & Harris | Total | |
| Resource Upgrade | $ millions | 9.3 | 6.0 | 15.3 |
| Metallurgy | $ millions | 8.2 | 3.1 | 11.3 |
| Geotechnical and Hydrology | $ millions | 0.2 | 0.8 | 1.0 |
| Pit design | $ millions | 0.4 | – | 0.4 |
| Infrastructure/PFS study | $ millions | 1.7 | – | 1.7 |
| Total | $ millions | 19.8 | 9.9 | 29.7 |
Ownership, Social License and Permitting
The Project is in Cochise County, Arizona, approximately 65 miles east of Tucson and is held or controlled 100% by GCC through its wholly owned subsidiary Excelsior Mining Arizona, Inc. (GCAZ) and Excelsior Mining Holdings Inc. (GCH).
The project is comprised of 18,796 acres including freehold land, patented land, state mineral claims and permits and BLM unpatented mining claims and excludes the Johnson Camp project. There is no federal nexus for permitting the project and all permitting is limited to State of Arizona-required permits including the Aquifer Protection Permit, Industrial Air permits and the Mined Land Reclamation Permit.
GCC has a well-developed community engagement plan that has been implemented through numerous public meetings and outreach programs. The Company intends to maintain this approach by continuing to engage with, and meet and discuss its projects with, the local and regional communities and stakeholders.
The Cochise Mining district has legacy mining assets and is a combination brownfields/greenfield site. The Company anticipates the Project will create decades of high paying jobs that will benefit the local communities and the state.
GCC has entered into an option agreement dated November 12, 2024 with certain local landowners providing the option for a period of six years to acquire a total of 3,906.57 acres of land. Portions of the Option Land will contain the proposed open pit and related infrastructure. The terms of the Option Agreement require an initial payment of $1,000,000, and annual payments of $250,000 in years 2, 3, 4 and 5 of the Option. The final purchase price for exercise of the Option is based on the exercise date and is set forth in the table below:
| Final Payment Date | Total Price | ||
| During the period within 1 year from Effective Date | $ | 28,000,000 | |
| During the period after 1 year but within 2 years from Effective Date | $ | 30,000,000 | |
| During the period after 2 years but within 3 years from Effective Date | $ | 31,250,000 | |
| During the period after 3 years but within 4 years from Effective Date | $ | 33,500,000 | |
| During the period after 4 years but within 5 years from Effective Date | $ | 35,750,000 | |
| During the period after 5 years but within 6 years from Effective Date | $ | 37,000,000 | |
There are certain other option agreements to acquire adjacent land holdings which will be detailed in the Report.
Royalties and Metal Stream
Greenstone Royalty: Greenstone Excelsior Holdings L.P. (“Greenstone”) holds a 3.0% gross revenue royalty over the Gunnison Project. The gross revenue royalty is defined as royalty percentage times receipts, which is the sum of physical product receipts and deemed receipts. The Greenstone royalty applies to the entirety of the Gunnison Project and production therefrom.
The Gunnison Project is also subject to a Metal Stream Agreement with Triple Flag Mining Finance Bermuda Ltd. that is applicable to all oxide minerals production from the parts of the Project located in the “Stream Area”. The Metal Stream Agreement is summarized in the table below, where mppa denotes million pounds per annum.
Triple Flag Metal Stream Agreement for the Gunnison Project
| Stream Deliveries | Excelsior Mining Arizona Inc. (“Seller“) is required to deliver Grade A Copper Cathodes in an amount equal to the “Payable Copper”. The amount of Payable Copper is calculated based on a percentage of the amount of copper that is sold and delivered to Offtakers under the terms of Offtake Agreements (for percentages see heading – Payable Copper). | |||||
| Payment | The Buyer pays to the Seller a price for copper equal to 25% of the daily official LME Grade A Settlement quotation for copper quoted in U.S. Dollars, as published in the Metal Bulletin. | |||||
| “Payable Copper” means a percentage of the Reference Copper equal to: | ||||||
| Payable Copper | Scenario | Stage 1 (25 mppa) |
Stage 2 (75 mppa) |
Stage 3 (125 mppa) |
||
| Upfront Deposit | 16.5% | 5.75% | 3.5% | |||
| Upfront Deposit + Expansion Option |
16.5% | 11.0% | 6.0% | |||
| At the current stage of the Project, the Buyer has made the initial Upfront Deposit ($65 million) and the Seller is ramping up to 25 mppa. | ||||||
| The “Expansion Option” provides Buyer the option to invest an additional $65 million in the event Seller approves an expansion to at least 50 mppa. | ||||||
Callinan Royalties Corporation (now a wholly owned subsidiary of Altius Minerals Corporation) holds a gross revenue royalty over the Gunnison Project. The gross revenue royalty is defined as royalty percentage times receipts which is the sum of physical product receipts and deemed receipts. The royalty rate is 1.625% while the plant capacity is less than 75 million pounds per annum and 1.5% once plant capacity is greater than or equal to 75 million pounds per annum.
Pursuant to the terms of the Bowlin option agreement, Bowlin Travel Centers, Inc. has been granted a 1% gross revenue royalty on any copper mined and processed from certain areas of the property.
The Arizona State Land Department (ASLD) owns a sliding net return royalty (2.0% to 8.0% and estimated at 5.5%), payable to ASLD and the State Trust.
The Strong & Harris property is subject to certain additional royalties that will be detailed in the Report.
Prior Operations
The Gunnison Project was previously designed as a copper in-situ recovery mine using solvent extraction-electrowinning to produce copper cathode. The ISR operation commenced ramp-up to production in 2020; however, as previously disclosed, it had operational issues related to low flow rates, so the Company began evaluating alternatives and opportunities to fix the ramp-up challenges. Well stimulation (small scale, shallow level, hydraulic fracking), has the potential to fundamentally change the performance of the wellfield and fix many of the low productivity issues. The Company has obtained a permit for well stimulation and the next step would be to conduct field trials. If well stimulation is successful, it could provide an operation with superior economics to the open pit operation and be in copper production much quicker than an open pit. However, due to the technical risks of ISR and substantially improved viability of the open pit operation, GCC intends to focus the PFS on an open pit operation as the alternative to ISR. If future financing is available for ISR activities, the Company may elect to conduct well stimulation field trials, but such field trials will not hinder the open pit studies. The Company intends to maintain the optionality of future ISR operations and well stimulation trials as this remains an asset to the Company. This includes maintaining full compliance with all regulatory and permit requirements, including maintaining hydraulic control, pumping, monitoring and regulatory reporting.
TECHNICAL REPORT AND QUALIFIED PERSONS
The Report will be filed on SEDAR+ and on GCC’s website within 45 days of the date of this news release. The Report will consist of a summary of the PEA. The Report is being prepared under the supervision of John Woodson, PE, SME-RM, of M3 Engineering & Technology Corporation, Tucson, Arizona, who is a Qualified Person that is independent of the Company. The Report will also receive contributions from the following additional Qualified Persons, who are also independent of the Company:
Each of these Qualified Persons has reviewed and approved the technical information contained in this news release that is relevant to their area of responsibility and verified the data underlying such technical information.
ABOUT GUNNISON COPPER
Gunnison Copper Corp. is a multi-asset pure-play copper developer and producer that controls the Cochise Mining District (the district), containing 12 known deposits within an 8 km economic radius, in the Southern Arizona Copper Belt.
Its flagship asset, the Gunnison Copper Project, has a Measured and Indicated Mineral Resource containing over 846.1 million tons with a total copper grade of 0.33% (Measured Mineral Resource of 191.5 million tons at 0.37% and Indicated Mineral Resource of 654.5 million tons at 0.31%), and a preliminary economic assessment (“PEA”) yielding robust economics including an NPV8% of $2 billion, IRR of 23%, and payback period of 3.9 years. It is being developed as a conventional operation with open pit mining, heap leach, and SX/EW refinery to produce finished copper cathode on-site with direct rail link.
The PEA is preliminary in nature and includes Inferred Mineral Resources that are considered too speculative geologically to have the economic considerations applied to them that would enable them to be categorized as mineral reserves. There is no certainty that the conclusions reached in the PEA will be realized. Mineral Resources that are not Mineral Reserves do not have demonstrated economic viability.
In addition, Gunnison’s Johnson Camp Asset, which is now in production, is fully funded by Nuton LLC, a Rio Tinto Venture, with a production capacity of up to 25 million lbs of finished copper cathode annually.
Other significant deposits controlled by Gunnison in the district, with potential to be economic satellite feeder deposits for Gunnison Project infrastructure, include South Star, and eight other deposits.
For more information on Gunnison, please visit our website at www.GunnisonCopper.com.
For further information regarding this press release, please contact:
Gunnison Copper Corp.
Concord Place, Suite 300, 2999 North 44th Street, Phoenix, AZ, 85018
Melissa Mackie
T: 647.533.4536
E: info@GunnisonCopper.com
www.GunnisonCopper.com
Aben Gold Corp. (TSX-V: ABM) (OTCID: ABNAF) (Frankfurt: ML1) announce... READ MORE
Neotech Metals Corp. (CSE: NTMC) (OTCQB: NTMFF) (FSE: V690) is pl... READ MORE
Southern Silver Exploration Corp. (TSX-V: SSV) reports that crews... READ MORE
Amex Exploration Inc. (TSX-V: AMX) (FSE: MX0) (OTCQX: AMXEF) is p... READ MORE
Mercado Minerals Ltd. (CSE: MERC) (OTCQB: MRMNF) announces furthe... READ MORE


