


Cash of $410.7 million at December 31, 2025
Discovery Silver Corp. (TSX: DSV, OTCQX: DSVSF) announced the Company’s financial and operating results for the fourth quarter and full year of 2025. Discovery began reporting the results of gold production and sales following the Company’s acquisition of the Porcupine Complex in and near Timmins, Ontario on April 15, 2025. The Company’s full financial statements and management discussion & analysis are available on SEDAR+ at www.sedarplus.ca and on the Company’s website at www.discoverysilver.com. All dollar amounts are in US dollars, unless otherwise noted.
Tony Makuch, Discovery’s CEO, commented: “We have built considerable momentum since acquiring Porcupine last April, with production in Q4 2025 totaling 66,718 ounces and operating cash costs improving to $1,185/oz. AISC has remained relatively unchanged as we have increased sustaining capital expenditures to provide needed investment for the Porcupine operations to achieve their full value potential. Our solid operating performance, in combination with higher gold prices, has resulted in improved profitability and substantial cash flow generation. We ended 2025 with a very strong financial position, with cash totaling $410.7 million and no debt.
“Another key area of accomplishment has been exploration. Last week, we reported excellent drilling results across our key Porcupine targets, including additional high-grade intersections from resource conversion and extension drilling at Hoyle Pond, Borden and Pamour; district drilling success at Owl Creek, as well as at the new Broulan target near Pamour; and very encouraging initial drilling results from our two key near-term growth projects, Dome and TVZ.
“Looking ahead, we issued our 2026 guidance today with our Q4 2025 results. The guidance includes significant production growth, reflecting higher output at Hoyle Pond and Borden, as well as increased production from open pit sources, including both Pamour and Hollinger, where we are currently resuming operations. Unit costs will be near the top of the target ranges in the first half of the year and improve significantly over the final six months as production levels increase, sustaining capital declines and we benefit from our investments in equipment, development and infrastructure at our operations. We will also be investing $55 – $75 million in exploration, which is a direct result of the success we are achieving and the tremendous upside we see at all our Porcupine operations and projects.”
SUMMARY OF Q4 AND FY 2025 PERFORMANCE
| Three months ended | Year ended | |||||||||
| (in $ thousands except per share amounts) | December 31, 2025 | December 31, 2024 | September 30, 2025 | December 31, 2025 | December 31, 2024 | |||||
| Revenue | 274,242 | — | 236,961 | 653,213 | — | |||||
| Production costs | 73,814 | — | 106,807 | 235,540 | — | |||||
| Earnings (loss) before income taxes | 60,349 | (5,663 | ) | 71,114 | 149,521 | (15,167 | ) | |||
| Net earnings (loss) | 65,289 | (5,663 | ) | 42,439 | 106,810 | (15,167 | ) | |||
| Basic earnings (loss) per share | 0.08 | (0.01 | ) | 0.05 | 0.16 | (0.04 | ) | |||
| Diluted earnings (loss) per share | 0.08 | (0.01 | ) | 0.05 | 0.15 | (0.04 | ) | |||
| Cash flow from (used in) operating activities | 163,231 | (2,937 | ) | 153,488 | 377,723 | (15,141 | ) | |||
| Cash investment on mine development and PPE | (95,324 | ) | 479 | (66,675 | ) | (205,532 | ) | (7,245 | ) | |
| Three months ended | Year ended | ||||||||||||||
| December 31, 2025 | December 31, 2024 | September 30, 2025 | December 31, 2025 | December 31, 2024 | |||||||||||
| Tonnes milled | 892,818 | — | 808,688 | 2,210,297 | — | ||||||||||
| Average Grade (g/t Au) | 2.58 | — | 2.69 | 2.80 | — | ||||||||||
| Recovery (%) | 90.2% | — | 90.3% | 90.5% | — | ||||||||||
| Gold produced (oz) | 66,718 | — | 63,154 | 180,424 | — | ||||||||||
| Gold sold (oz)(1) | 64,479 | — | 66,200 | 173,229 | — | ||||||||||
| Average realized price ($/oz sold)(2) | $ | 4,157 | $ | — | $ | 3,489 | $ | 3,701 | $ | — | |||||
| Operating cash costs per ounce sold ($/oz sold)(2) | $ | 1,185 | $ | — | $ | 1,339 | $ | 1,267 | $ | — | |||||
| AISC per ounce sold ($/oz sold)(2)(3) | $ | 2,034 | $ | — | $ | 1,734 | $ | 1,925 | $ | — | |||||
| Adjusted net earnings(2) | $ | 113,495 | $ | (4,320 | ) | $ | 61,090 | $ | 199,974 | $ | (10,736 | ) | |||
| Adjusted net earnings per share(2) | $ | 0.14 | $ | (0.01 | ) | $ | 0.08 | $ | 0.29 | $ | (0.03 | ) | |||
| Free cash flow(2) | $ | 67,907 | $ | (2,458 | ) | $ | 86,813 | $ | 172,191 | $ | (22,386 | ) | |||
(1) The difference between ounces produced and ounces sold largely reflects the delivery of in-kind ounces under the Franco-Nevada royalty arrangement.
(2) Example of Non-GAAP measure. See the section in this press release entitled, “NON-GAAP MEASURES” for more information.
(3) 2025 results exclude G&A expense, share-based compensation costs and sustaining capital expenditures and lease expense incurred prior to April 15, 2025, the completion date of the Porcupine Acquisition.
Q4 2025
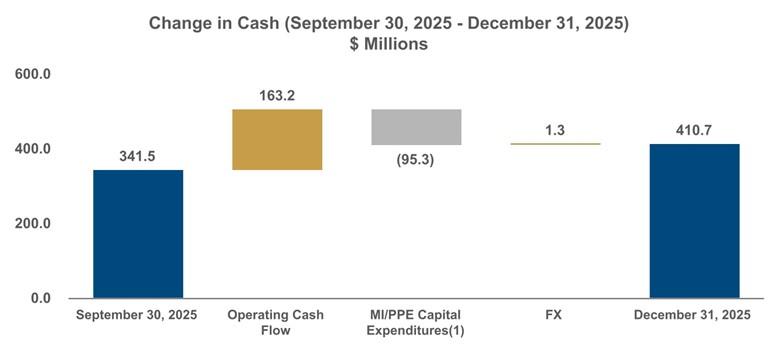
(1) Represents cash capital expenditures incurred during Q4 2025
FY 2025
Discovery did not generate revenue or earnings from mine operations in FY 2024 or Q1 2025.
(1) Example of Non-GAAP measure. See the section of this press release entitled, “NON-GAAP MEASURES” for more information.
(2) Refers to earnings before interest, taxes and depreciation and amortization.
Income Statement Summary
| Three months ended | Year ended | ||||||||||||||
| (in thousands except per share amounts) | December 31, 2025 |
December 31, 2024 |
September 30, 2025 |
December 31 2025 |
December 31, 2024 |
||||||||||
| Revenue | $ | 274,242 | $ | – | $ | 236,961 | $ | 653,213 | $ | – | |||||
| Production costs | 73,814 | – | 106,807 | 235,540 | – | ||||||||||
| Depreciation and amortization | 49,381 | – | 35,826 | 101,591 | – | ||||||||||
| Royalties | 7,859 | – | 3,619 | 13,394 | – | ||||||||||
| Earnings from mining operations | 143,188 | – | 90,709 | 302,688 | – | ||||||||||
| Expenses | |||||||||||||||
| General and administration | 16,695 | 4,834 | 6,661 | 51,707 | 10,492 | ||||||||||
| Exploration | 340 | (2 | ) | 5,972 | 7,167 | 373 | |||||||||
| Impairment | — | — | 2,140 | 2,140 | — | ||||||||||
| Share-based compensation | 461 | 1,212 | 1,398 | 4,979 | 3,235 | ||||||||||
| Other operating costs | 47,512 | — | — | 47,512 | — | ||||||||||
| Earnings from operations | 78,180 | (6,044 | ) | 74,538 | 189,183 | (14,100 | ) | ||||||||
| Other | |||||||||||||||
| Other income (loss) | (3,623 | ) | 186 | 9,301 | (1,012 | ) | (2,592 | ) | |||||||
| Finance Items | |||||||||||||||
| Finance expense (income), net | (14,208 | ) | 195 | (12,725 | ) | (38,650 | ) | 1,525 | |||||||
| Earnings before taxes | 60,349 | (5,663 | ) | 71,114 | 149,521 | (15,167 | ) | ||||||||
| Current income tax expense (recovery) | 26,255 | – | 32,462 | 85,088 | – | ||||||||||
| Deferred income tax expense (recovery) | (31,195 | ) | – | (3,787 | ) | (42,377 | ) | – | |||||||
| Net (loss) earnings | $ | 65,289 | $ | (5,663 | ) | $ | 42,439 | $ | 106,810 | $ | (15,167 | ) | |||
| Basic earnings per share | $ | 0.08 | $ | (0.01 | ) | $ | 0.05 | $ | 0.16 | $ | (0.04 | ) | |||
| Diluted earnings per share | $ | 0.08 | $ | (0.01 | ) | $ | 0.05 | $ | 0.15 | $ | (0.04 | ) | |||
| Weighted average number of common shares outstanding (in 000’s) | |||||||||||||||
| Basic | 805,988 | 400,415 | 802,837 | 687,819 | 398,386 | ||||||||||
| Diluted | 828,211 | 400,415 | 825,798 | 710,042 | 398,386 | ||||||||||
PORCUPINE OPERATIONS REVIEW
Discovery’s Porcupine Operations consist of the Hoyle Pond, Pamour and Hollinger mine properties, the Dome mine property and milling facility, and numerous near-mine and regional exploration targets. The Complex also includes the Borden mine property and large land position near Chapleau, Ontario. Current operations include the Hoyle Pond and Borden underground mines, with the Pamour open-pit project ramping up towards commercial levels of production. All mineralization is processed at Dome, including mineralization from Borden, which is trucked 190 km to the Dome Mill. The Dome Mill is a 12,000 tonne-per-day processing facility that in recent years has operated at rates well below optimal levels. Through investment programs launched following the closing of the Porcupine Acquisition, the Company is targeting a return to full capacity operations by 2027 or sooner.
| Three months ended | Year ended | ||||||||
| Porcupine Complex | December 31, 2025 | September 30, 2025 | December 31, 2025 | ||||||
| Tonnes processed (t) | 892,818 | 808,688 | 2,210,297 | ||||||
| Average Grade (g/t Au) | 2.58 | 2.69 | 2.80 | ||||||
| Recovery (%) | 90.2% | 90.3% | 90.5% | ||||||
| Gold produced (oz)(1) | 66,718 | 63,154 | 180,424 | ||||||
| Gold poured (oz)(1) | 67,010 | 65,978 | 179,605 | ||||||
| Gold sold (oz)(1)(2) | 64,479 | 66,200 | 173,229 | ||||||
| Milling costs (in thousands) | $ | 19,354 | $ | 17,107 | $ | 49,351 | |||
| Milling costs per tonne processed ($/tonne) | $ | 21.7 | $ | 21.2 | $ | 22.3 | |||
| Production costs | $ | 73,814 | $ | 106,807 | $ | 235,540 | |||
| Operating cash costs per ounce sold(3)(4) | $ | 1,185 | $ | 1,339 | $ | 1,267 | |||
| AISC per ounce sold(3)(4) | $ | 1,824 | $ | 1,699 | $ | 1,781 | |||
| Total capital expenditures(3)(4) (in thousands) | $ | 96,581 | $ | 65,976 | $ | 204,189 | |||
(1) Includes gold production, poured and sold from Hoyle Pond, Borden and Pamour.
(2) The difference between ounces produced and ounces sold largely reflects the delivery of in-kind ounces under the Franco-Nevada royalty arrangement.
(3) Example of Non-GAAP measure. See the section in this press release entitled, “NON-GAAP MEASURES” for more information.
(4) Operating cash costs per ounce sold, AISC per ounce sold and total capital expenditures are site level and exclude remaining corporate G&A, share-based compensation costs and corporate-level sustaining capital expenditures.
During Q4 2025, a total of 892,818 tonnes were processed at Porcupine Complex at an average grade of 2.58 g/t, with recovery rates averaging 90.2%, which compared to 808,688 tonnes at an average grade of 2.69 g/t and recovery rates averaging 90.3% in the previous quarter. A total of 66,718 ounces of gold were produced over this period, with total gold poured of 67,010 ounces, compared to 63,154 and 65,978 ounces produced and poured respectively, in the previous quarter. Higher production in Q4 2025 reflected the favourable impact of increased ore mining rates at Pamour and higher average grades at Hoyle Pond, Borden, and Pamour, partially offset by lower mining rates at Borden. The change in the combined average grade for the Porcupine Complex to 2.58 g/t in Q4 2025 from 2.69 g/t in the previous quarter, reflected a higher proportion of tonnes processed from Pamour.
Availability rates at the Dome Mill during Q4 2025 were impacted by a scheduled four-day maintenance shutdown in October, with an additional nine hours of scheduled maintenance in November. Based on operating days during Q4 2025, mill throughput averaged approximately 10,145 tonnes per day. Mill operating costs during Q4 2025 averaged $21.68 per tonne processed, similar to $21.15 per tonne processed for the previous quarter.
For FY 2025, representing operations for the period from April 16, 2025 to December 31, 2025, a total of 2,210,297 tonnes were processed at Dome Mill at an average grade of 2.80 g/t, with recovery rates averaging 90.5%. A total of 180,424 ounces of gold were produced over this period, with total gold poured of 179,605 ounces. Total mill operating costs were $49.4 million for FY 2025, for an average of $22.33 per tonne processed.
Production costs, including mining and processing costs, in Q4 2025 totaled $73.8 million versus $106.8 million in the previous quarter. Operating cash costs1 per ounce sold averaged $1,185 compared to $1,339 in the previous quarter. Site-level AISC1,2 averaged $1,824 per ounce sold compared to $1,699 in Q3 2025. The quarter-over-quarter increase in AISC reflected a 49% increase in sustaining capital expenditures1 to $32.9 million in Q4 2025, which were mainly related to increased mobile equipment procurement at Hoyle Pond and higher level of capital development at both Hoyle Pond and Borden.
For FY 2025, production costs totaled $235.5 million, with operating cash costs averaging $1,267 per ounce sold and AISC averaging $1,781 per ounce sold. Included in AISC were $69.7 million of sustaining capital expenditures related to capital development and expenditures related to TMA6.
(1) Example of Non-GAAP measure. See the section in this press release entitled, “NON-GAAP MEASURES” for more information.
(2) Site-level AISC includes corporate G&A allocation and excludes remaining G&A, share-based compensation costs and corporate-level sustaining capital expenditures.
CORDERO OVERVIEW
The Cordero Project was acquired by Discovery in 2019. Since that time, the Company has invested over $100.0 million in Mexico, conducting significant exploration drilling and technical analysis, leading to the release of multiple studies, most recently the Feasibility Study dated February 16, 2024 and filed on SEDAR+ (www.sedarplus.ca) on March 28, 2024. The results of the FS confirmed Cordero to be one of the world’s largest undeveloped silver deposits, with the potential for large-scale production at low unit costs, is capable of generating substantial free cash flow and attractive economic returns.
Key highlights of the FS include:
Fourth Quarter 2025 Highlights
During Q4 2025, Discovery continued work on key initiatives to further de-risk the project, including:
(1) AgEq produced is metal recovered in concentrate. AgEq is calculated as Ag + (Au x 72.7) + (Pb x 45.5) + (Zn x 54.6); these factors are based on metal prices of Ag – $22/oz, Au – $1,600/oz, PB – $1,00/lb and Zn – $1.20/lb use in the February 2024 FS.
(2) Example of Non-GAAP measure. See the section in this press release entitled, “NON-GAAP MEASURES” for more information.
2026 GUIDANCE
| Total | ||
| (in $ millions, unless otherwise stated) | ||
| Gold produced (koz) | 260 – 300 | |
| Operating cash costs per ounce sold ($/oz sold)(1) | $ | 1,250 – 1,400 |
| AISC per ounce sold ($/oz sold)(1) | $ | 1,950 – 2,250 |
| Royalties(2) | $ | 25 – 35 |
| Sustaining capital expenditures(1) | $ | 120 – 165 |
| Porcupine – Growth capital expenditures(1) | $ | 195 – 235 |
| Cordero – Fees and capital | $ | 90 – 100 |
| Exploration (capital & expensed) | $ | 55 – 75 |
| Corporate G&A(3) | $ | 35 – 40 |
(1) Example of Non-GAAP measure. See the section in this press release entitled, “NON-GAAP MEASURES” for more information.
(2) Royalty expense is included in operating cash cost and AISC per ounce sold. Royalty expense does not include costs related to the Franco Nevada Royalties.
(3) Corporate G&A excludes share-based compensation.
(4) Based on, where applicable, a USD/CAD exchange rate of 1.36 and a USD/MXN$ exchange rate of 18.0.
Discovery’s 2026 guidance outlines a plan for increased production, that is expected to ramp up and peak during the second half of the year. Operating cash costs per ounce sold1, AISC1 per ounce sold and capital expenditures1 are projected to be the highest in the first half of the year.
Targets for both sustaining1 and growth1 capital expenditures in 2026, reflect planned investment in support of the Company’s goal of more than doubling gold production, to over half a million ounces per year, with a cost profile in the lower half of the global cost curve. The Company’s guidance also includes a significant commitment to exploration given the substantial potential that exists to convert and expand mineral resources at existing operations and to identify new resources at the Porcupine operations, near-term projects and regional targets.
Gold Production
Gold production in 2026 is targeted to reach 260,000 – 300,000 ounces, with production weighted towards the second half of the year. Hoyle Pond and Borden are expected to account for approximately two-thirds of gold production in 2026, with the remaining third coming from open-pit mining sources. Open pit production will come from Pamour, as well as the Hollinger open pit, where production resumed early in 2026, and is expected to ramp up as the year progresses.
Unit Costs
Operating cash costs per ounce sold are projected to be highest in the first two quarters of 2026, and average $1,250 – $1,400 per ounce for the full year. Operating cash costs per ounce sold in 2026 are expected to benefit from increased volumes, resulting from higher planned processing rates at the Dome Mill, at similar grades, the impact of which will be offset by increased mining and processing costs and higher royalties as a result of an increase in the average realized gold price1. AISC per ounce sold is targeted at $1,950 – $2,250, reflecting higher sustaining capital expenditures and increased royalties compared to 2025. Unit costs are expected to be higher in the first half of the year, due to lower production levels, as mine operations at Hollinger ramp up, with AISC impacted by the weighting of sustaining capital expenditures to the first six months of 2026.
Royalties
Royalty expense in 2026 is expected to total $25 – $35 million. Royalty expense is highly dependent on the average realized gold price and will fluctuate dependent on the commodity cycle. Royalty expense primarily relates to royalty agreements with First Nations groups and private interests at Borden and, to a lesser extent, at Hoyle Pond and Pamour. Royalty expense does not include costs related to the Franco Nevada Royalties, which are accounted for as deferred revenue and are recognized when the performance obligations under the royalty agreement are satisfied. Interest expense is recorded based on the total deferred revenue balance.
Porcupine Sustaining Capital Expenditures
Sustaining capital expenditures for 2026 are projected to be $120 – $165 million primarily related to work to buttress the No. 6 tailings management area at the Dome property, as well as ongoing investments in capital improvements at the Dome Mill, new mobile equipment and improved infrastructure at Hoyle Pond and Borden. Planned capital development at both operations is required to achieve production targets. The replacement of mobile fleets at Hoyle Pond and Borden is an important initiative that will support future production growth and greater efficiency through improved cycle times for haulage, enhanced backfill rates and reduced ongoing maintenance costs.
Porcupine Growth Capital Expenditures
Growth capital expenditures at Porcupine are targeted at $195 – $235 million . Two key projects contributing to planned growth capital in 2026 include increasing tailings capacity at TMA6 through additional raises and by executing a new deposition strategy, and continued pre-stripping at Pamour, as the mine ramps up towards commercial levels of operation. The new deposition strategy at TMA6 involves dividing the #6 Dam into cells, which will support higher volumes and facilitate progressive rehabilitation, as completed cells can be rehabilitated prior to closure of the dam. Additional key projects include a new ventilation raise to be developed at Borden, and expenditures related to capital development and sump upgrades to support longer-term operations at Hoyle Pond.
Cordero
Fees and growth capital related to Cordero of $90 – $100 million are primarily for the fees required for permits and include capital to advance engineering studies for water treatment and power. A significant component of planned expenditures at Cordero relates to the anticipated payment of the change of land use permit fee. This permit, and payment of the related fee, will follow the approval of the Environmental Impact Statement (“Manifesto de Impacto Ambiental” or “MIA”) application by the Mexican Government’s Department of Natural Resources and Environment (“Secretaría de Medio Ambiente y Recursos Naturales” or “SEMARNAT”).
Exploration
Total exploration expenditures in 2026, including both capitalized and expensed expenditures, are targeted at $55 – $75 million. The Company exploration work program for the year involves an estimated 255,000 – 280,000 metres of drilling, as well as 1,200 – 1,400 metres of exploration development.
Capital exploration expenditures in 2026 are expected to total $25 – $35 million and relate mainly to continued resource conversion and expansion drilling at Hoyle Pond, Borden and Pamour. Key targets include the S Zone Deep and XMS Zone at Hoyle Pond, the further northeast extension of the Main Zone and infill of the Far West and East Lower Zones at Borden and within and along strike all three phases of the Pamour pit design. Capitalized exploration expenditures also include planned drilling at Dome designed to upgrade and add confidence to current inferred resources located on the edges and below the historic Dome pit. In addition, the Company is also targeting completion of 500 – 1,000 metres of underground exploration development at Hoyle Pond and Borden.
Expensed exploration expenditures are targeted at $30 – $40 million and involve work in the mid and upper-mine at Hoyle Pond, at the TVZ Zone adjacent to Hoyle Pond, and at Owl Creek, three kilometres west along the Hoyle Pond volcanic belt. Other key targets for expensed exploration include the down plunge extension of the Main Zone and East Lower Zone at Borden, a number of district targets around Pamour, including the Broulan Pit, AAA Trend and Keora Trend, and regional targets such as the Hollinger-McIntyre and Paymaster properties.
As at February 18, 2026, the Company had 20 exploration drill rigs operating. A breakout of drill-rig locations and related targets is provided below:
| Hoyle Pond: | Five underground drills – Three drills involved in resource conversion and extension drilling of the S Zone and two drills evaluating targets in the mid-mine. |
| TVZ Zone: | Two underground drills – One drill on the 1210 level focused on infilling and extending mineralization, and a drill on the 1680 level testing the down plunge extension of mineralization. |
| Owl Creek: | Two surface drills – Both drills are targeting mineralization near surface and at depth at Owl Creek, as well as towards the 750 Zone, located approximately 850 metres to the east. |
| Borden: | Six drills (four underground and two surface) – Three drill rigs involved in infill and expansion drilling targeting the Main (Deep) Zone to the northeast and one involved in infill and extension of the East Lower Zone, with two surface drills exploring to the northeast of the mine. |
| Pamour: | Four surface drills – Three drills focused on conversion drilling of the resource pit and one drill exploring targets near the Broulan Pit. |
| Dome: | One surface drill – Focused on the northeast portion of the historic open pit; work is also advancing to evaluate additional drill targets to the north, south and below the pit. |
Corporate G&A
Corporate G&A in 2026 is estimated at $35 – $40 million. Expenditure levels are expected to increase in 2026 reflecting the full-year impact of the Company’s transformation into a growing Canadian gold producer, and the related strengthening of organizational capabilities across operations, exploration, and corporate functions, such as finance and information technology.
(1) Example of Non-GAAP measure. See the section in this press release entitled, “NON-GAAP MEASURES” for more information.
ABOUT DISCOVERY
Discovery is a growing precious metals company that is creating value for stakeholders through exposure to both gold and silver. The Company’s silver exposure comes from its first asset, the 100%-owned Cordero project, one of the world’s largest undeveloped silver deposits, which is located close to infrastructure in a prolific mining belt in Chihuahua State, Mexico. On April 15, 2025, Discovery completed the acquisition of the Porcupine Complex, transforming the Company into a new Canadian gold producer with multiple operations in one of the world’s most renowned gold camps in and near Timmins, Ontario. Discovery owns a dominant land position within the camp, with a large base of Mineral Resources remaining and substantial growth and exploration upside.
Falco Resources Ltd. (TSX-V:FPC) is pleased to announce the resul... READ MORE
TDG Gold Corp. (TSX-V: TDG) (OTCQX: TDGGF) is pleased to provide ... READ MORE
Extension drilling extended mineralization beyond the current pit... READ MORE
Abcourt Mines Inc. (TSX-V: ABI) (OTCQB: ABMBF) continues its work... READ MORE
Premier American Uranium Inc. (TSX-V: PUR) (OTCQB: PAUIF) is plea... READ MORE


